Is It Too Late To Consider Williams Companies (WMB) After A 29% One Year Rally?
Williams Companies, Inc. WMB | 0.00 |
- If you are wondering whether Williams Companies at around US$73.76 is offering good value or asking too much, the key is to look past the headline price and into how it stacks up on a few core valuation checks.
- The stock has returned 0.6% over the last 7 days, 1.6% over the last 30 days, 21.2% year to date and 29.2% over the past year, so the current price already reflects a meaningful shift in how the market views the company.
- Recent news coverage has focused on Williams Companies as a large US energy infrastructure player, including discussion of its role in transporting and processing natural gas and related products. This context around its asset base and industry position helps explain why investors are watching the stock at current levels.
- The company currently scores 2/6 on our valuation checks, so the next step is to compare how different valuation methods treat the stock, and then look at an approach later in the article that goes a step further in tying valuation back to the underlying business story.
Williams Companies scores just 2/6 on our valuation checks. See what other red flags we found in the full valuation breakdown.
Approach 1: Williams Companies Discounted Cash Flow (DCF) Analysis
A Discounted Cash Flow model takes projected future cash flows, discounts them back to today using a required rate of return, and adds them up to estimate what the business might be worth per share right now.
For Williams Companies, the latest twelve month Free Cash Flow is about $2.1b. Using a 2 Stage Free Cash Flow to Equity model, analysts have provided annual cash flow estimates through 2030, with Simply Wall St extrapolating further out to 2035. By 2030, projected Free Cash Flow is $5.0b, with later years extending into the $6.4b to $10.8b range based on those extrapolations.
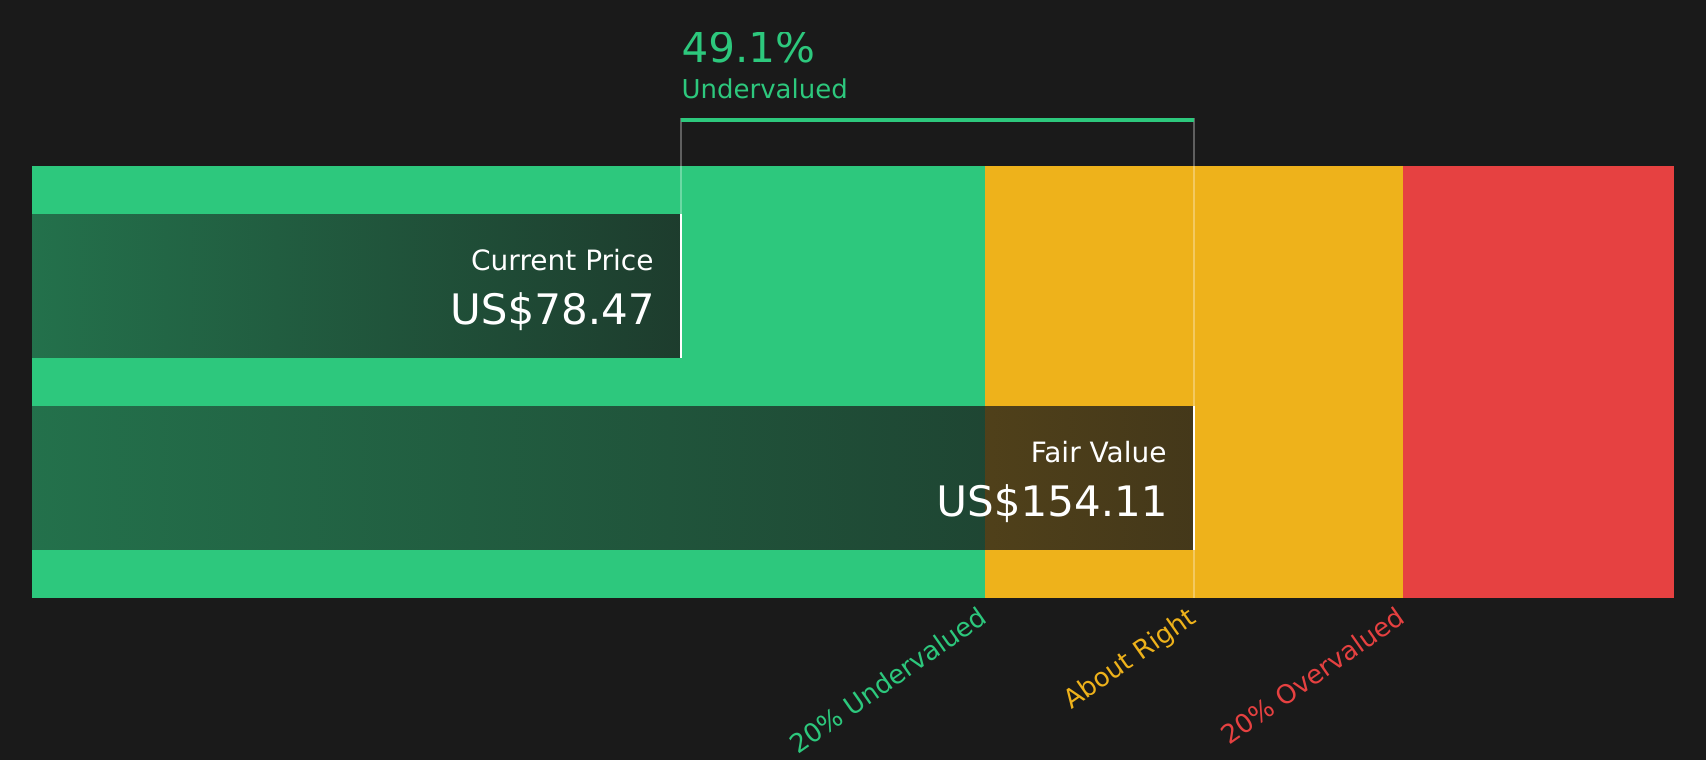
When all of these projected cash flows are discounted back to today, the model arrives at an estimated intrinsic value of $154.95 per share. Compared with the current share price of about $73.76, the DCF output implies the stock is roughly 52.4% undervalued on this method.
Result: UNDERVALUED
Our Discounted Cash Flow (DCF) analysis suggests Williams Companies is undervalued by 52.4%. Track this in your watchlist or portfolio, or discover 44 more high quality undervalued stocks.
Approach 2: Williams Companies Price vs Earnings
For a profitable company, the P/E ratio is a useful shorthand for how much investors are paying today for each dollar of current earnings. It lets you compare what the market is willing to pay for this company’s profits against other stocks and broad groups of peers.
What counts as a “normal” or “fair” P/E depends on how fast earnings are expected to grow and how risky those earnings are. Higher growth or lower perceived risk can support a higher P/E, while lower growth or higher risk usually points to a lower P/E.
Williams Companies currently trades on a P/E of 32.34x, compared with an Oil and Gas industry average of 13.86x and a peer average of 15.97x. Simply Wall St’s Fair Ratio metric for Williams Companies is 30.15x. The Fair Ratio is a proprietary estimate of what the P/E might be given factors such as earnings growth, industry, profit margin, market cap and company specific risks. This makes it more tailored than a simple peer or industry comparison.
Since the current P/E of 32.34x is above the Fair Ratio of 30.15x by more than 0.10, this points to the stock trading at a premium on this measure.
Result: OVERVALUED

P/E ratios tell one story, but what if the real opportunity lies elsewhere? Start investing in legacies, not executives. Discover our 19 top founder-led companies.
Upgrade Your Decision Making: Choose your Williams Companies Narrative
Earlier valuation checks like DCF and P/E told you what the numbers say, but Narratives help you explain why by letting you set a story for Williams Companies, link that story to explicit assumptions on future revenue, earnings and margins, and translate it into a Fair Value that you can compare directly to today’s share price to see whether your view points to a potential opportunity or a potential risk.
On Simply Wall St’s Community page, Narratives are available as an easy tool used by millions of investors. You can quickly select or adjust a Williams Companies Narrative, see the forecast and Fair Value that result, and then decide for yourself whether the gap between Fair Value and price is wide enough to justify action.
These Narratives do not stay static. They update when fresh information such as earnings releases, analyst target changes or major project news is added to the platform. This keeps the link between the company’s story, its forecast and its Fair Value current without you needing to rebuild everything from scratch.
For Williams Companies today, one Narrative on the Community page uses a higher Fair Value of about US$90.00, another uses a lower Fair Value closer to US$64.46, and a third uses the analyst consensus near US$80.07. This shows how different yet reasonable stories about future gas demand and project execution can lead to very different views on what the stock might be worth.
For Williams Companies however we will make it really easy for you with previews of two leading Williams Companies Narratives:
Fair value in this bullish narrative: US$80.07 per share
Implied discount to this fair value versus the recent US$73.76 price: about 7.9% undervalued
Revenue growth assumption used in this view: 11.26% a year
- Focuses on expanding pipeline capacity, LNG export connections and higher utilization across the network as key drivers for future cash flows.
- Assumes gradual improvement in profit margins alongside a large, fully contracted project backlog that runs beyond 2030.
- Builds a fair value close to the analyst consensus target, with earnings projections out to 2029 and a future P/E of around 31x.
Fair value in this bearish narrative: US$64.46 per share
Implied premium to this fair value versus the recent US$73.76 price: about 14.4% overvalued
Revenue growth assumption used in this view: 8.69% a year
- Emphasizes the risk that faster decarbonization, renewables growth and energy policy changes could limit long term natural gas demand.
- Highlights potential pressure from high capital spending, permitting challenges and the risk of underused pipeline assets.
- Uses lower margin assumptions and a different earnings path to arrive at a fair value below the current share price, even with a future P/E of about 30.86x.
These two Narratives sit on opposite sides of the same data, so use them as reference points to stress test your own assumptions about Williams Companies, especially around future gas demand, project execution and what P/E you are comfortable using for those long range earnings.
Do you think there's more to the story for Williams Companies? Head over to our Community to see what others are saying!

This article by Simply Wall St is general in nature. We provide commentary based on historical data and analyst forecasts only using an unbiased methodology and our articles are not intended to be financial advice. It does not constitute a recommendation to buy or sell any stock, and does not take account of your objectives, or your financial situation. We aim to bring you long-term focused analysis driven by fundamental data. Note that our analysis may not factor in the latest price-sensitive company announcements or qualitative material. Simply Wall St has no position in any stocks mentioned.