Is It Too Late To Look At AerCap Holdings (AER) After A 52% One-Year Rally?
AerCap Holdings NV AER | 139.18 | -0.56% |
- If you are wondering whether AerCap Holdings is still attractively priced after a strong run, this article walks through what the current share price might be implying about its value.
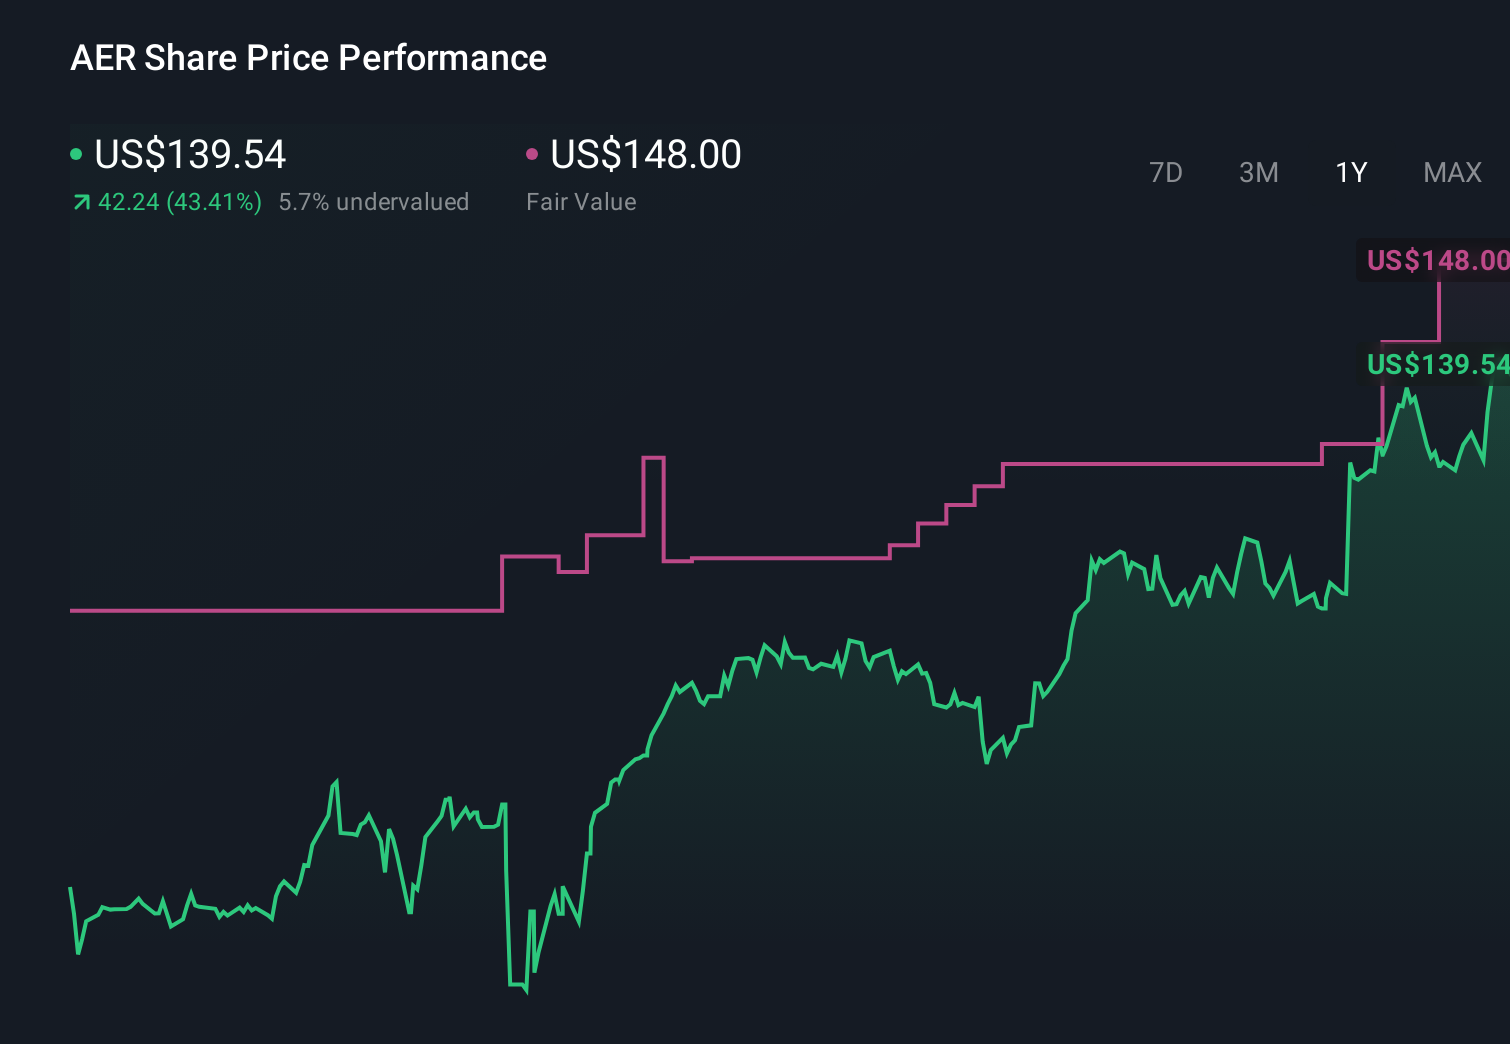
- The stock closed at US$143.66 recently, with returns of 51.7% over 1 year and 131.9% over 3 years, while the last 7 days and year to date have been roughly flat, with small declines of 0.9% and 0.7%.
- Recent price moves sit against a backdrop of ongoing interest in aircraft leasing companies and their role in supporting global air travel capacity, as airlines adjust their fleets and financing choices. Sector related headlines and broader sentiment toward travel and capital goods businesses help frame how investors are currently thinking about AerCap as a listed lessor.
- AerCap currently scores 5 out of 6 on our valuation checks. This sets up a closer look at how methods such as discounted cash flow, multiples and asset based measures line up, and also hints at an even deeper way to think about value that we will come back to at the end.
Approach 1: AerCap Holdings Discounted Cash Flow (DCF) Analysis
A Discounted Cash Flow, or DCF, model estimates what a company might be worth by projecting its future cash flows and then discounting those back to today using a required rate of return.
For AerCap Holdings, the model used here is a 2 Stage Free Cash Flow to Equity approach, based on cash flow projections expressed in US$. The latest twelve month free cash flow figure is a loss of $819 million. Looking ahead, analysts and model assumptions point to free cash flow of $920 million in 2026, with further annual projections extending out to 2035. Those later years, such as the $5,758.98 million estimate for 2035, are extrapolated beyond the formal analyst horizon.
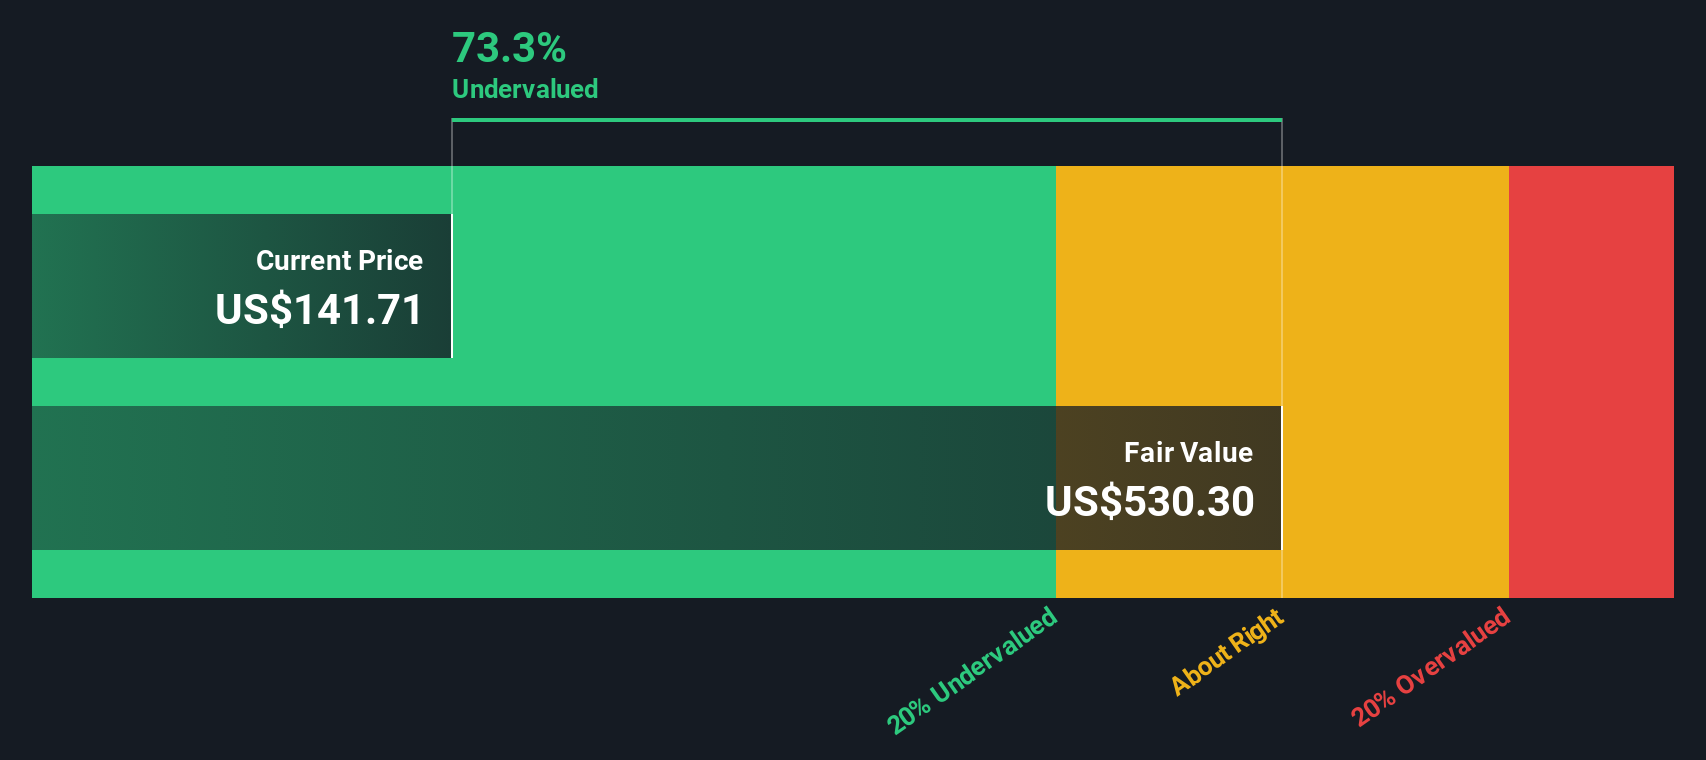
When all projected free cash flows are discounted back and combined with terminal assumptions, the DCF model arrives at an estimated intrinsic value of about $194.82 per share. Against the recent share price of $143.66, this implies the stock is 26.3% undervalued based on these inputs and assumptions.
Result: UNDERVALUED
Our Discounted Cash Flow (DCF) analysis suggests AerCap Holdings is undervalued by 26.3%. Track this in your watchlist or portfolio, or discover 868 more undervalued stocks based on cash flows.
Approach 2: AerCap Holdings Price vs Earnings
For a profitable company, the P/E ratio is a straightforward way to see how much investors are currently paying for each dollar of earnings. This makes it a useful cross check to a cash flow based model.
What counts as a “normal” P/E depends on how quickly earnings are expected to grow and how risky those earnings are. Higher growth and lower perceived risk often support a higher multiple, while slower growth or higher risk usually point to a lower one.
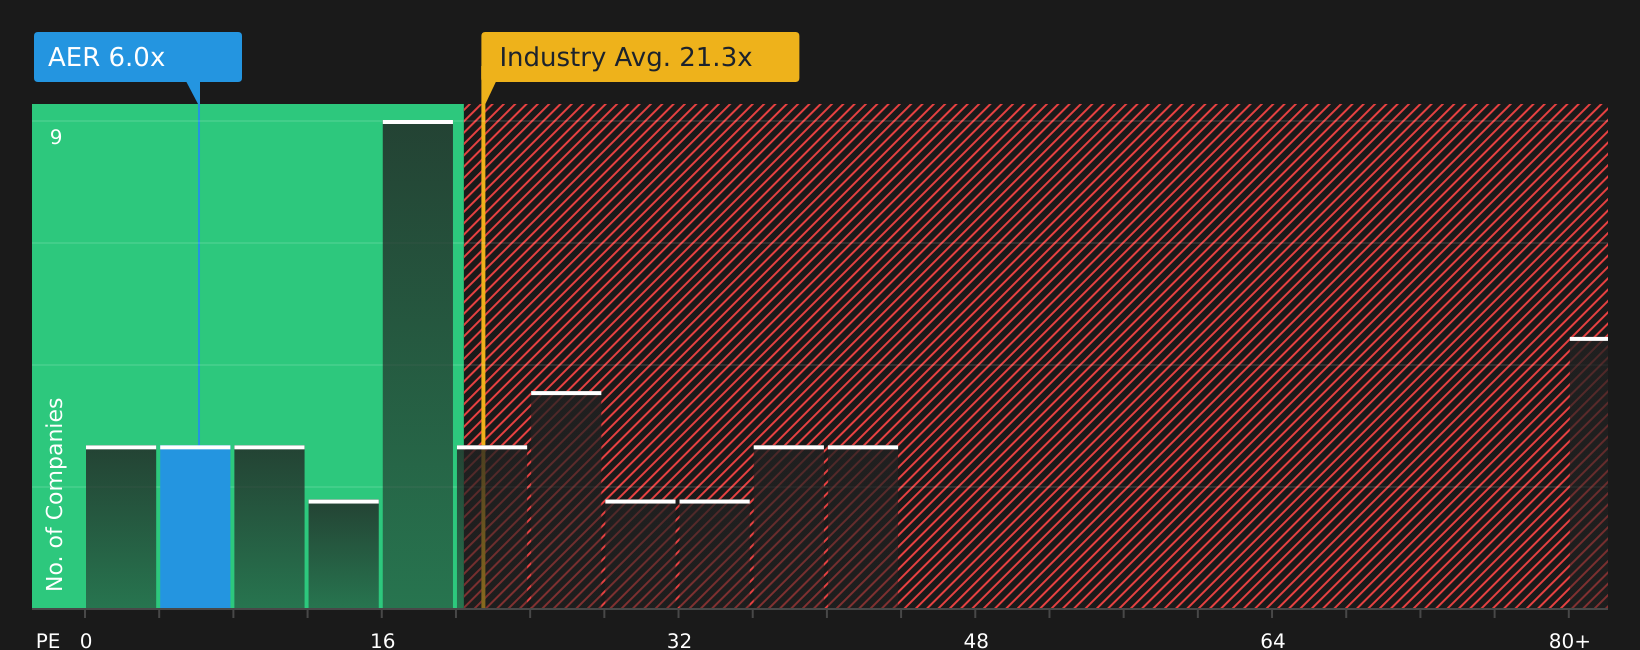
AerCap is trading on a P/E of 6.30x, compared with the Trade Distributors industry average of 22.65x and a peer group average of 26.30x. Simply Wall St’s “Fair Ratio” for AerCap is 10.99x, which is its proprietary estimate of what a reasonable P/E could be for this specific business given factors like earnings growth, profit margin, industry, market cap and key risks.
This Fair Ratio is more tailored than a simple comparison with peers or the industry, because it adjusts for company specific qualities rather than assuming all firms should trade on the same multiple. With AerCap’s actual P/E of 6.30x sitting below the Fair Ratio of 10.99x, the shares screen as potentially undervalued on this measure.
Result: UNDERVALUED
P/E ratios tell one story, but what if the real opportunity lies elsewhere? Discover 1417 companies where insiders are betting big on explosive growth.
Upgrade Your Decision Making: Choose your AerCap Holdings Narrative
Earlier we mentioned that there is an even better way to understand valuation. Let us introduce you to Narratives, which let you put a clear story behind your numbers, including your fair value and your own expectations for AerCap’s future revenue, earnings and margins.
A Narrative links what you believe about a company’s business to a forecast, and then to a fair value estimate. You can then compare that fair value to the current share price and decide whether AerCap looks appealing, fully priced, or expensive based on your view.
On Simply Wall St, Narratives sit inside the Community page. Millions of investors use them as a simple tool to turn their ideas into numbers. Those Narratives then update when new news, earnings or other data arrives, so your view does not stay frozen in time.
For AerCap, one investor might build a Narrative that assumes a higher fair value because they expect stronger future cash generation. Another investor might choose a lower fair value based on more cautious assumptions about future earnings and margins.
Do you think there's more to the story for AerCap Holdings? Head over to our Community to see what others are saying!
This article by Simply Wall St is general in nature. We provide commentary based on historical data and analyst forecasts only using an unbiased methodology and our articles are not intended to be financial advice. It does not constitute a recommendation to buy or sell any stock, and does not take account of your objectives, or your financial situation. We aim to bring you long-term focused analysis driven by fundamental data. Note that our analysis may not factor in the latest price-sensitive company announcements or qualitative material. Simply Wall St has no position in any stocks mentioned.