Is It Too Late To Reassess AIG (AIG) After Recent Insurance Sector Interest?
American International Group, Inc. AIG | 0.00 |
- Investors may be wondering whether American International Group at around US$78 still offers value or if most of the opportunity is already priced in.
- The stock recently closed at US$78.47, with returns of 5.8% over 7 days and 4.0% over 30 days. Year to date it shows a 6.9% decline and a 2.8% decline over 1 year, compared with gains of 57.9% over 3 years and 74.4% over 5 years.
- Recent news has highlighted ongoing interest in large insurers as investors reassess sector risk and capital strength. Coverage has focused on how established insurers like American International Group fit into portfolios that balance income potential with exposure to insurance cycles.
- Right now, American International Group has a valuation score of 2 out of 6. A next step is to look at the standard valuation checks investors usually rely on, followed by a different way of thinking about value that can help put all of these numbers in context.
American International Group scores just 2/6 on our valuation checks. See what other red flags we found in the full valuation breakdown.
Approach 1: American International Group Excess Returns Analysis
The Excess Returns model looks at how much profit a company can generate over and above the return that shareholders require, based on its equity and profitability. It then capitalizes those surplus returns to estimate what the stock could be worth today.
For American International Group, the model uses a Book Value of $75.82 per share and a Stable EPS of $8.98 per share, sourced from weighted future Return on Equity estimates from 8 analysts. The Average Return on Equity is 10.43%, while the Cost of Equity is $6.12 per share. That gap creates an estimated Excess Return of $2.86 per share.
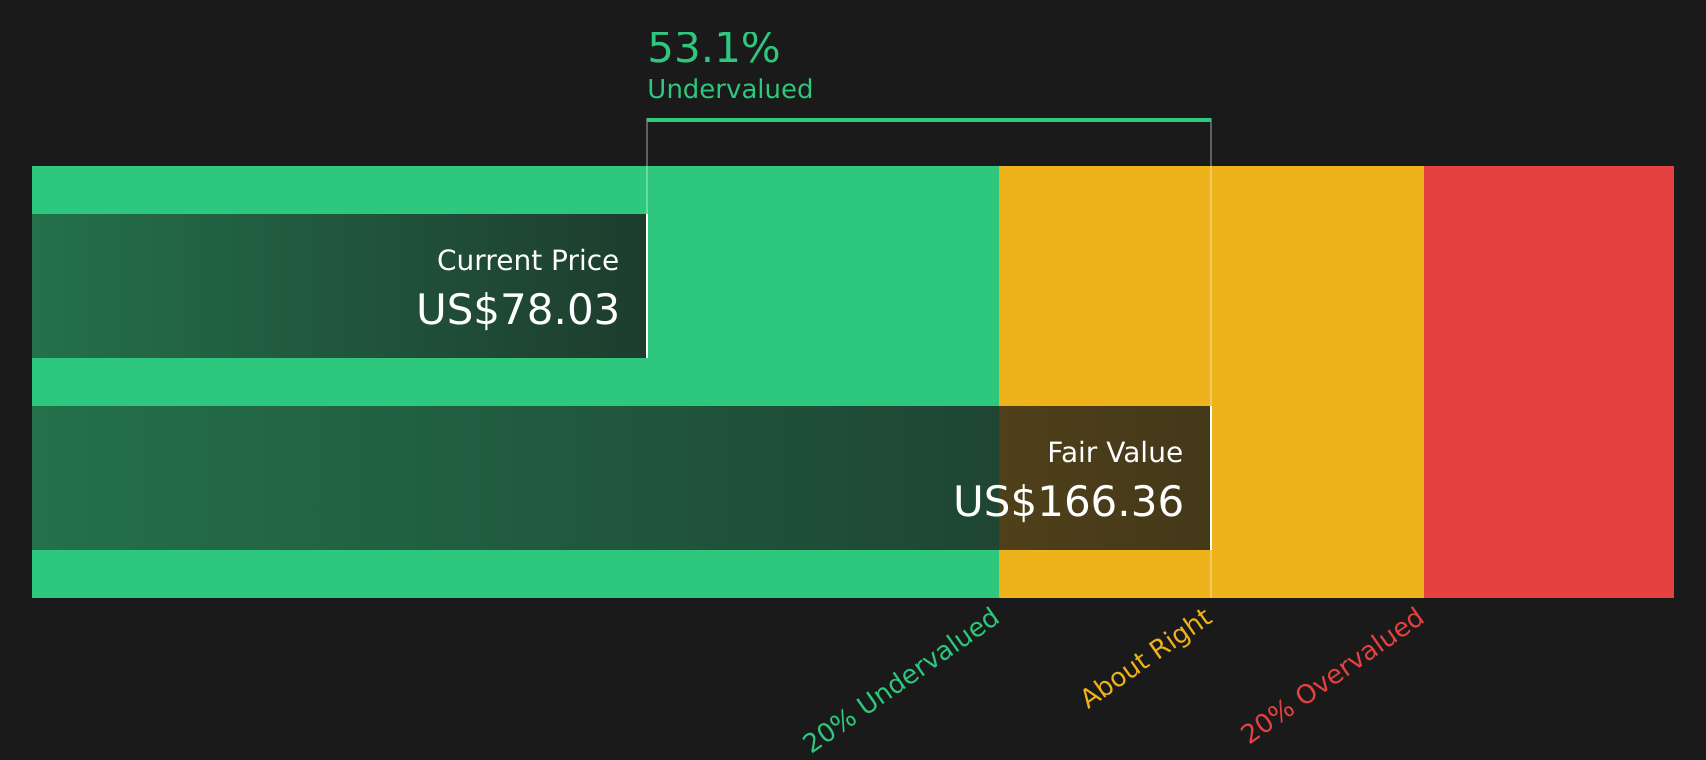
The analysis also factors in a Stable Book Value of $86.17 per share, based on weighted future Book Value estimates from 10 analysts. Putting these inputs together, the Excess Returns model arrives at an intrinsic value of about $166.31 per share, which sits well above the recent share price around $78.47. That gap implies the stock is 52.8% undervalued on this basis.
Result: UNDERVALUED
Our Excess Returns analysis suggests American International Group is undervalued by 52.8%. Track this in your watchlist or portfolio, or discover 51 more high quality undervalued stocks.
Approach 2: American International Group Price vs Earnings
For profitable companies, the P/E ratio is a useful yardstick because it connects what you pay for the stock with the earnings generated per share. It also reflects how the market weighs growth potential and risk, since higher expected growth or lower perceived risk is often associated with a higher “normal” or “fair” P/E, while slower growth or higher risk usually aligns with a lower one.
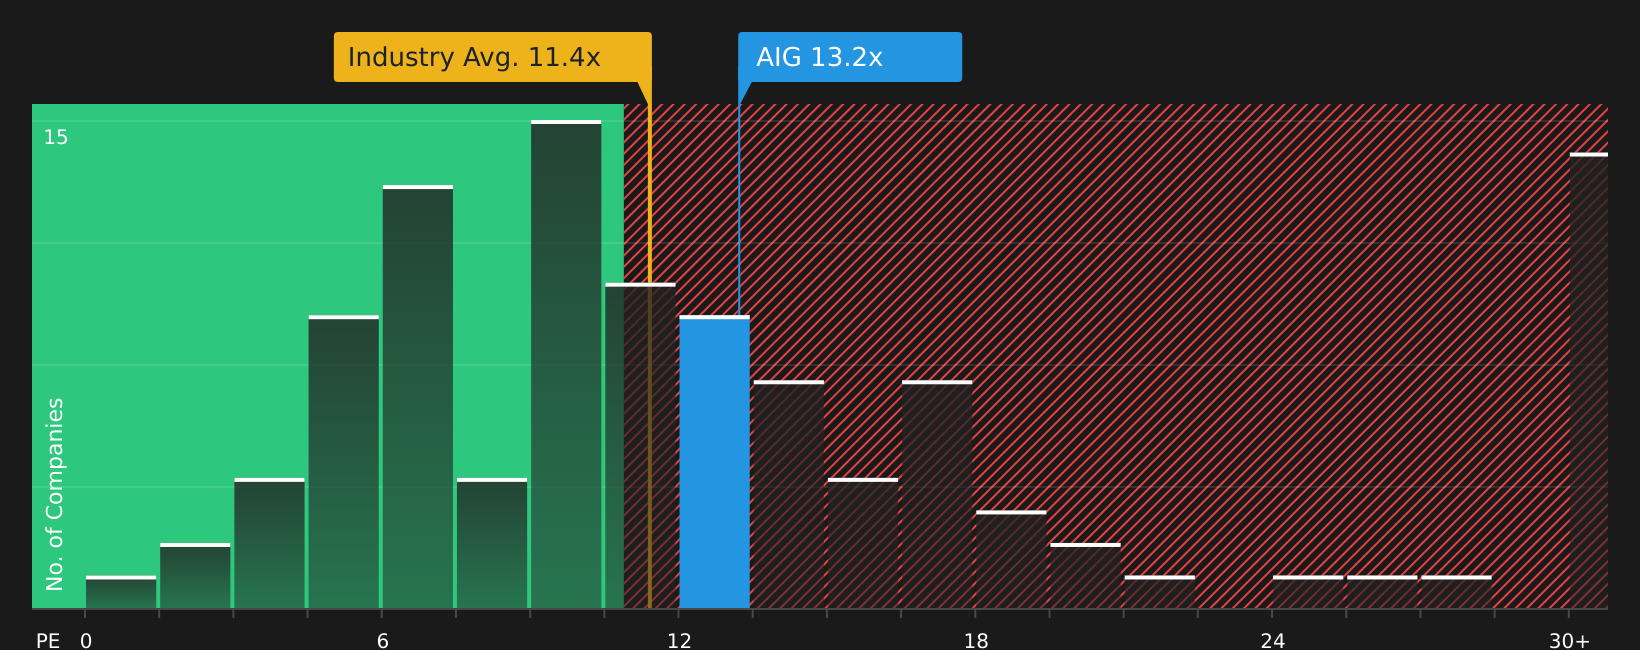
American International Group currently trades on a P/E of 13.16x. This sits above the Insurance industry average of 11.45x and the peer average of 8.86x. Simply Wall St’s Fair Ratio for the stock is 12.83x. This Fair Ratio is a proprietary estimate of what P/E might be reasonable for American International Group given factors such as its earnings growth profile, industry, profit margins, market capitalization and identified risks.
Compared with a simple peer or industry comparison, the Fair Ratio is intended to be more tailored to the company because it adjusts for those fundamentals instead of assuming all insurers deserve the same multiple. Setting the current P/E of 13.16x against the Fair Ratio of 12.83x suggests the stock is slightly expensive on this metric.
Result: OVERVALUED
P/E ratios tell one story, but what if the real opportunity lies elsewhere? Start investing in legacies, not executives. Discover our 19 top founder-led companies.
Upgrade Your Decision Making: Choose your American International Group Narrative
Earlier it was mentioned that there is an even better way to understand valuation. Narratives on Simply Wall St’s Community page let you turn your view of American International Group into a clear story that links assumptions about future revenue, earnings and margins to a fair value, updates that view automatically when fresh news or earnings arrive, and then helps you decide what action makes sense by comparing that fair value with the live share price. This is why some investors might build a more optimistic American International Group Narrative around the US$101.0 analyst target, while others lean on a more cautious story closer to US$78.0, even though both are using the same underlying company data.
Do you think there's more to the story for American International Group? Head over to our Community to see what others are saying!

This article by Simply Wall St is general in nature. We provide commentary based on historical data and analyst forecasts only using an unbiased methodology and our articles are not intended to be financial advice. It does not constitute a recommendation to buy or sell any stock, and does not take account of your objectives, or your financial situation. We aim to bring you long-term focused analysis driven by fundamental data. Note that our analysis may not factor in the latest price-sensitive company announcements or qualitative material. Simply Wall St has no position in any stocks mentioned.