

Is It Too Late To Revisit F5 (FFIV) After Its Strong Year To Date Rally?
F5, Inc. FFIV | 0.00 |
- If you are wondering whether F5 at around US$383 per share offers fair value or is pricing in too much optimism, you are not alone.
- The stock is down 2.6% over the last week, but up 16.9% over the past month, 49.4% year to date, 34.4% over the last year, 161.3% over three years and 103.1% over five years, which naturally raises questions about what is now baked into the price.
- Recent coverage has focused on F5's role in application security and multi cloud networking, as investors weigh how these themes fit into long term demand for its products and services. That context is important because sentiment around these areas often influences how much investors are willing to pay for the stock.
- Simply Wall St currently gives F5 a valuation score of 3/6. The rest of this article will walk through what that means across different valuation methods and point to an even more complete way to think about value at the end.
Approach 1: F5 Discounted Cash Flow (DCF) Analysis
A Discounted Cash Flow model estimates what a stock could be worth by projecting future cash flows and discounting them back to today, using the idea that cash received in the future is worth less than cash received now.
For F5, the model used is a 2 Stage Free Cash Flow to Equity approach, based on cash flow projections expressed in $. The latest twelve month free cash flow is about $967.8m. Analyst estimates and subsequent extrapolations by Simply Wall St point to projected free cash flow of $1,342.0m in 2029, with additional forecasts extending out to 2035.
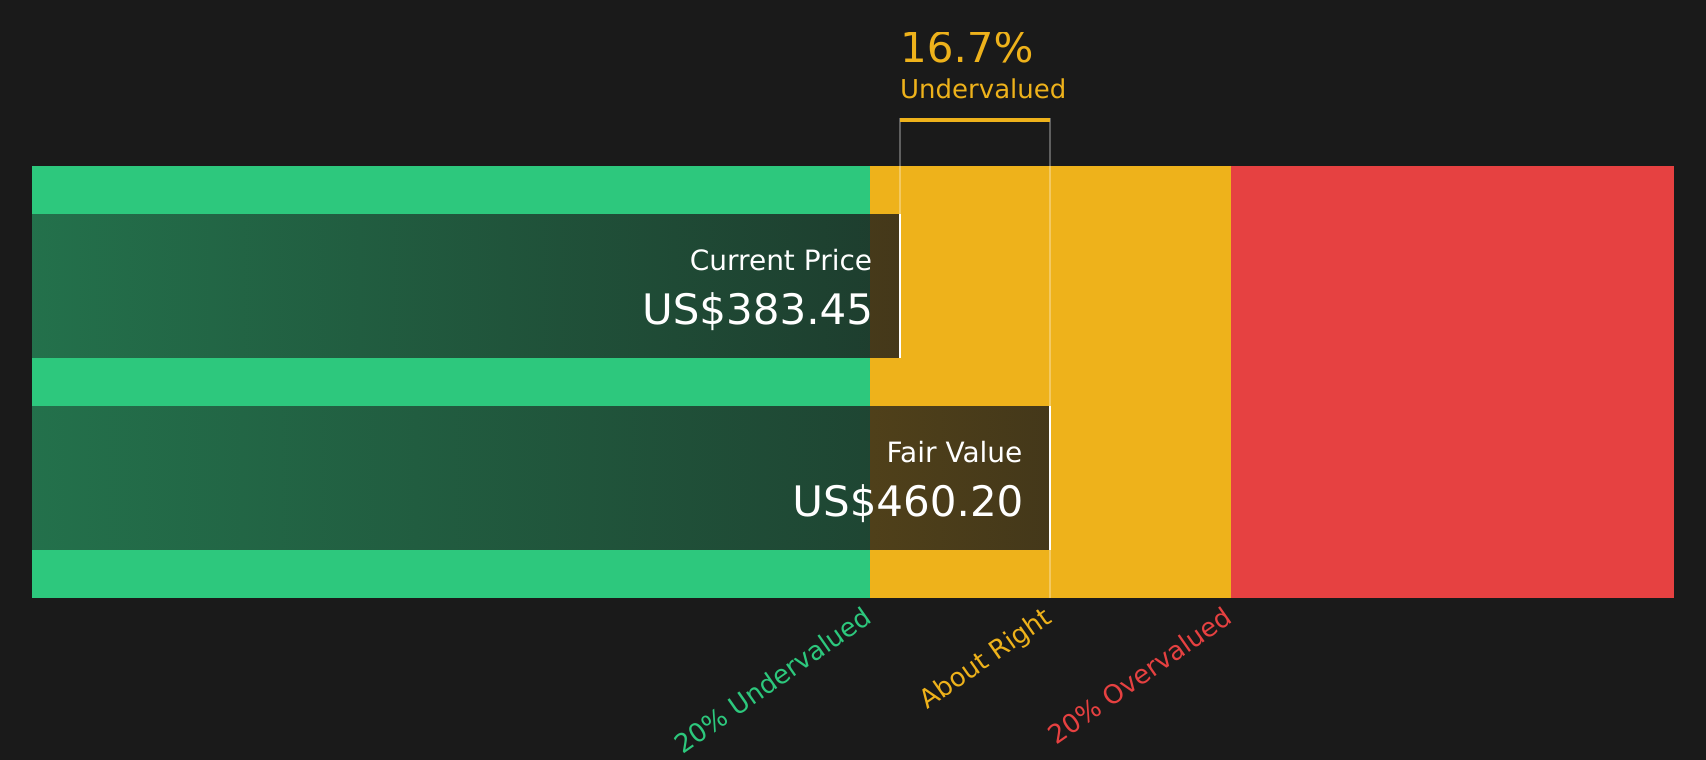
When these projected cash flows are discounted back and summed, the model arrives at an estimated intrinsic value of about $459.74 per share. Compared with the current share price of around $383, the DCF output suggests F5 is trading at roughly a 16.6% discount to this estimate, which indicates the stock appears undervalued on this methodology.
Result: UNDERVALUED
Our Discounted Cash Flow (DCF) analysis suggests F5 is undervalued by 16.6%. Track this in your watchlist or portfolio, or discover 46 more high quality undervalued stocks.
Approach 2: F5 Price vs Earnings (P/E)
For profitable companies like F5, the P/E ratio is a common way to think about value, because it links what you pay for each share to the earnings that each share generates.
Investors usually accept a higher P/E when they expect stronger earnings growth or see lower risk, and a lower P/E when they expect slower growth or higher risk. So there is no single “right” P/E, but there are useful reference points.
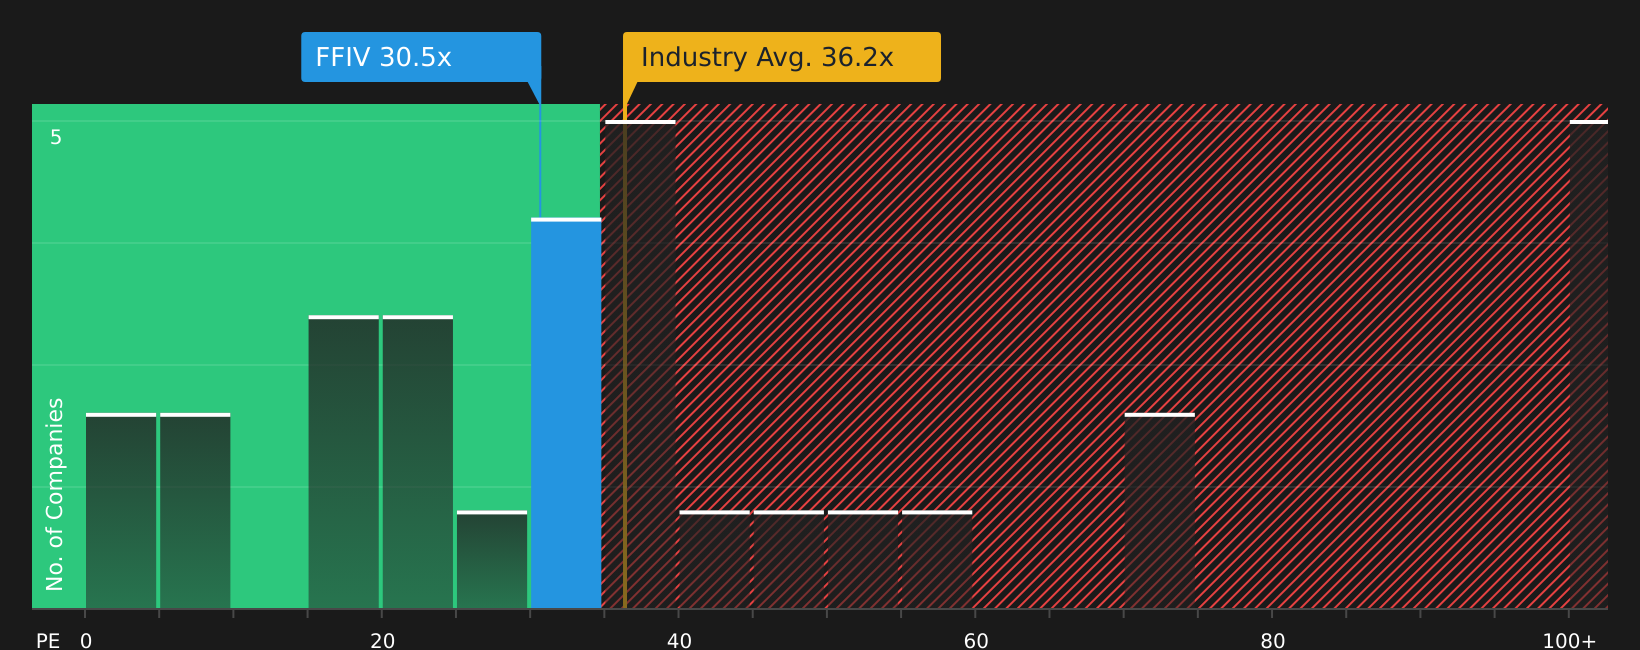
F5 currently trades on a P/E of 30.55x. That sits below the peer group average of 63.06x and also below the wider Communications industry average P/E of 36.19x. On those simple comparisons, the stock looks cheaper than many alternatives in its space.
Simply Wall St’s Fair Ratio for F5 is 28.46x. This is a proprietary estimate of what F5’s P/E might be based on factors such as its earnings growth profile, industry, profit margins, market cap and company specific risks.
This Fair Ratio can be more informative than a basic peer or industry comparison, because it adjusts for differences in growth, risk and profitability instead of assuming all companies should trade on the same multiple. With F5’s actual P/E of 30.55x only modestly above the Fair Ratio of 28.46x, the stock screens as slightly expensive on this metric.
Result: OVERVALUED
P/E ratios tell one story, but what if the real opportunity lies elsewhere? Start investing in legacies, not executives. Discover our 20 top founder-led companies.
Upgrade Your Decision Making: Choose your F5 Narrative
Earlier it was mentioned that there is an even better way to understand valuation. Meet Narratives, a simple way for you to attach a clear story about F5 to the numbers you care about, such as your view of fair value and expectations for future revenue, earnings and margins. You can then link that story to a financial forecast and a fair value estimate that you can compare with the current share price.
Narratives on Simply Wall St, available to you on the Community page used by millions of investors, turn those views into a structured forecast and fair value that update automatically when fresh information like earnings or news is added. This means your view on F5 stays current without extra work.
For F5, one investor might align with a higher fair value near the more optimistic US$475.0 price target, assuming that by 2029 revenue reaches about US$4.1b, earnings are around US$1.1b and the P/E is 29.8x using an 8.6% discount rate. Another investor might lean closer to the lower US$250.0 target with assumptions nearer US$3.9b of revenue, US$989.4m of earnings and a 23.4x P/E on an 8.7% discount rate. Comparing each Narrative fair value to today’s price can help you decide whether the stock appears attractive, fully priced or expensive relative to your own story.
For F5 however we will make it really easy for you with previews of two leading F5 Narratives:
Fair value in this bullish narrative: US$464.25 per share
Implied discount to this fair value vs last close: about 17.4% below the narrative fair value
Revenue growth assumption: 8.1% a year
- Emphasis on hybrid multicloud, application security and AI related use cases supporting demand across systems, software and SaaS.
- Analyst assumptions include revenue of about US$4.1b and earnings of US$1.1b by 2029, with higher profit margins and a P/E of 29.8x on those earnings.
- Risks focus on potential slowing in AI and multicloud projects, higher component costs, competitive pressure in security and regional demand shifts.
Fair value in this more cautious narrative: US$337.40 per share
Implied premium to this fair value vs last close: about 13.6% above the narrative fair value
Revenue growth assumption: 6.9% a year
- Assumes solid demand from hybrid multicloud adoption and AI security, along with a gradual mix shift toward higher margin software and subscriptions.
- Builds in expectations for revenue of about US$3.9b and earnings of US$989.4m by 2029, paired with a P/E of 23.4x on those earnings and ongoing share count reduction.
- Highlights execution risks around the hardware to software transition, competition from hyperscalers and security vendors and the possibility that current hardware strength fades faster than software revenue grows.
If you want to go beyond these previews and see how other investors are framing the same numbers into full stories that update as new data comes in, See what the community is saying about F5.
Do you think there's more to the story for F5? Head over to our Community to see what others are saying!

This article by Simply Wall St is general in nature. We provide commentary based on historical data and analyst forecasts only using an unbiased methodology and our articles are not intended to be financial advice. It does not constitute a recommendation to buy or sell any stock, and does not take account of your objectives, or your financial situation. We aim to bring you long-term focused analysis driven by fundamental data. Note that our analysis may not factor in the latest price-sensitive company announcements or qualitative material. Simply Wall St has no position in any stocks mentioned.