Is Janus Henderson Group (JHG) Still Priced Attractively After Strong Multi‑Year Share Gains
Janus Henderson Group PLC JHG | 51.50 | +0.16% |
- If you are wondering whether Janus Henderson Group's current share price still makes sense, you are not alone. Many investors are asking if the stock offers solid value at today's level.
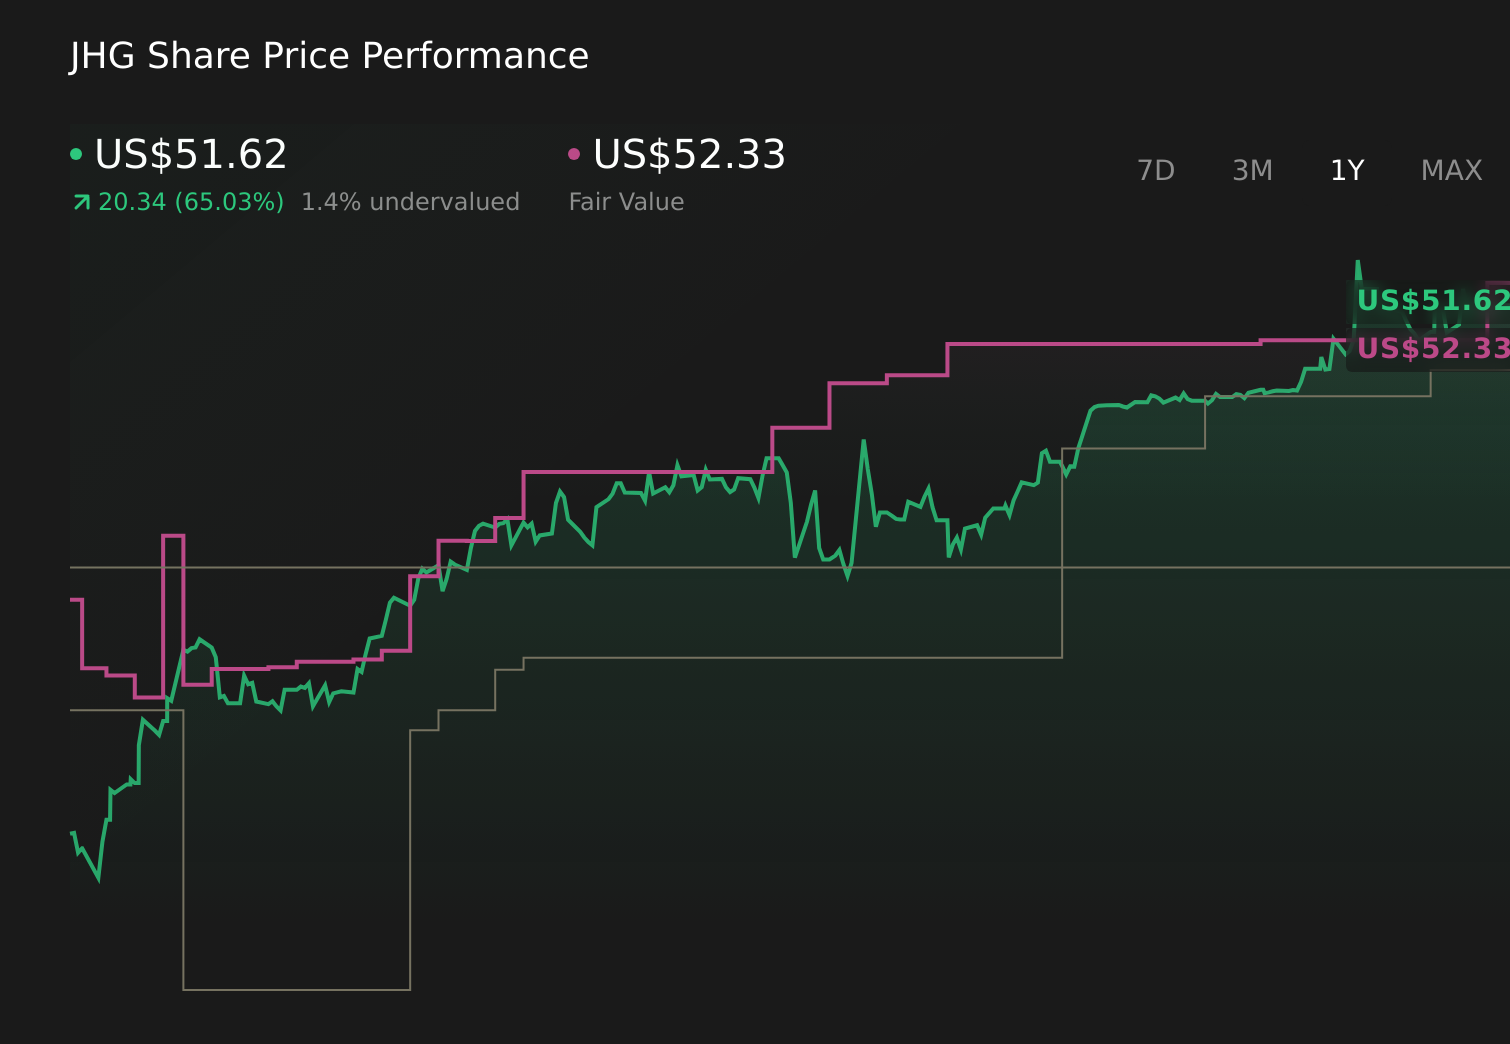
- The shares last closed at US$48.19, with returns of 0.5% over 7 days, 0.3% over 30 days, 0.9% year to date and 9.3% over 1 year, while 3-year and 5-year returns sit at very large levels close to a 2x gain.
- Recent attention on Janus Henderson Group has been shaped by coverage of its position in the global asset management industry and how investors view fee based businesses in the current market. Commentary has also focused on how listed asset managers are trading compared to broader financial stocks, which helps frame how sentiment is feeding into Janus Henderson Group's share price.
- On Simply Wall St's valuation checks, Janus Henderson Group scores 3 out of 6. Next, we will look at what different valuation methods say about the shares and then finish with a more rounded way to think about value beyond a single score.
Approach 1: Janus Henderson Group Excess Returns Analysis
The Excess Returns model looks at how much profit a company can generate above the return that shareholders require, based on its equity. It starts with what the business is earning on its book value and compares that to the cost of equity to see whether each dollar invested is adding value.
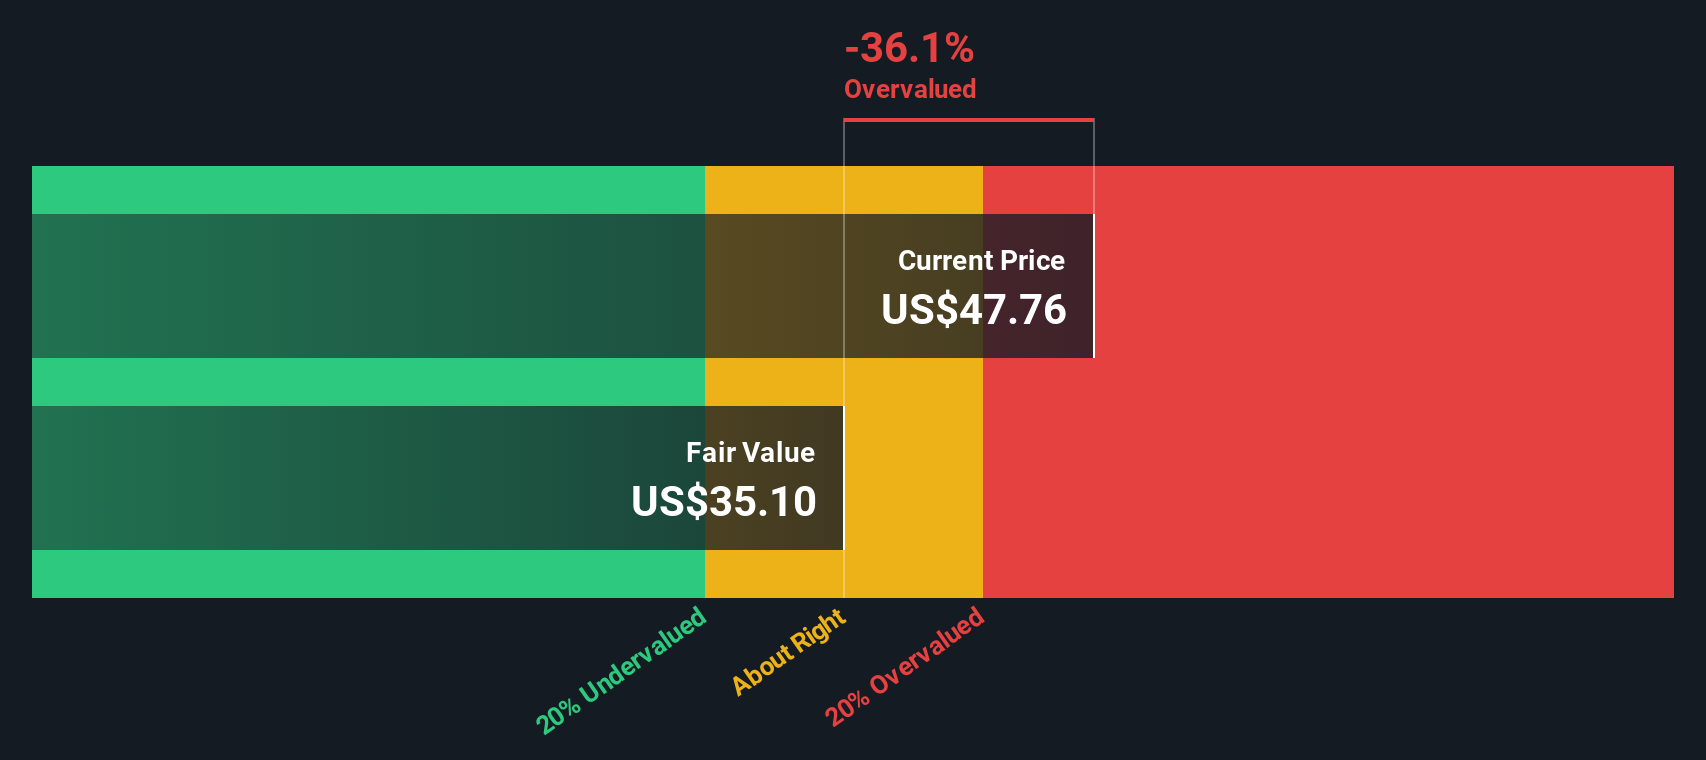
For Janus Henderson Group, the model uses a Book Value of US$35.26 per share and a Stable EPS of US$3.16 per share, based on the median return on equity from the past 5 years. The Cost of Equity is set at US$2.95 per share, which implies an Excess Return of US$0.21 per share. The Average Return on Equity used in the model is 9.15%, and the Stable Book Value input is US$34.58 per share, based on weighted future book value estimates from 2 analysts.
Putting these inputs together, the Excess Returns model produces an intrinsic value of US$38.68 per share. Compared with the recent share price of US$48.19, this framework suggests the stock is around 24.6% overvalued.
Result: OVERVALUED
Our Excess Returns analysis suggests Janus Henderson Group may be overvalued by 24.6%. Discover 55 high quality undervalued stocks or create your own screener to find better value opportunities.
Approach 2: Janus Henderson Group Price vs Earnings
For a profitable company like Janus Henderson Group, the P/E ratio is a straightforward way to relate what you pay for the stock to what the business is currently earning per share. It gives you a quick sense of how many dollars investors are willing to pay today for each dollar of earnings.
What counts as a “normal” P/E depends a lot on how investors see the company’s growth potential and risk profile. Higher expected growth or lower perceived risk can support a higher P/E, while slower growth or higher risk usually leads to a lower multiple.
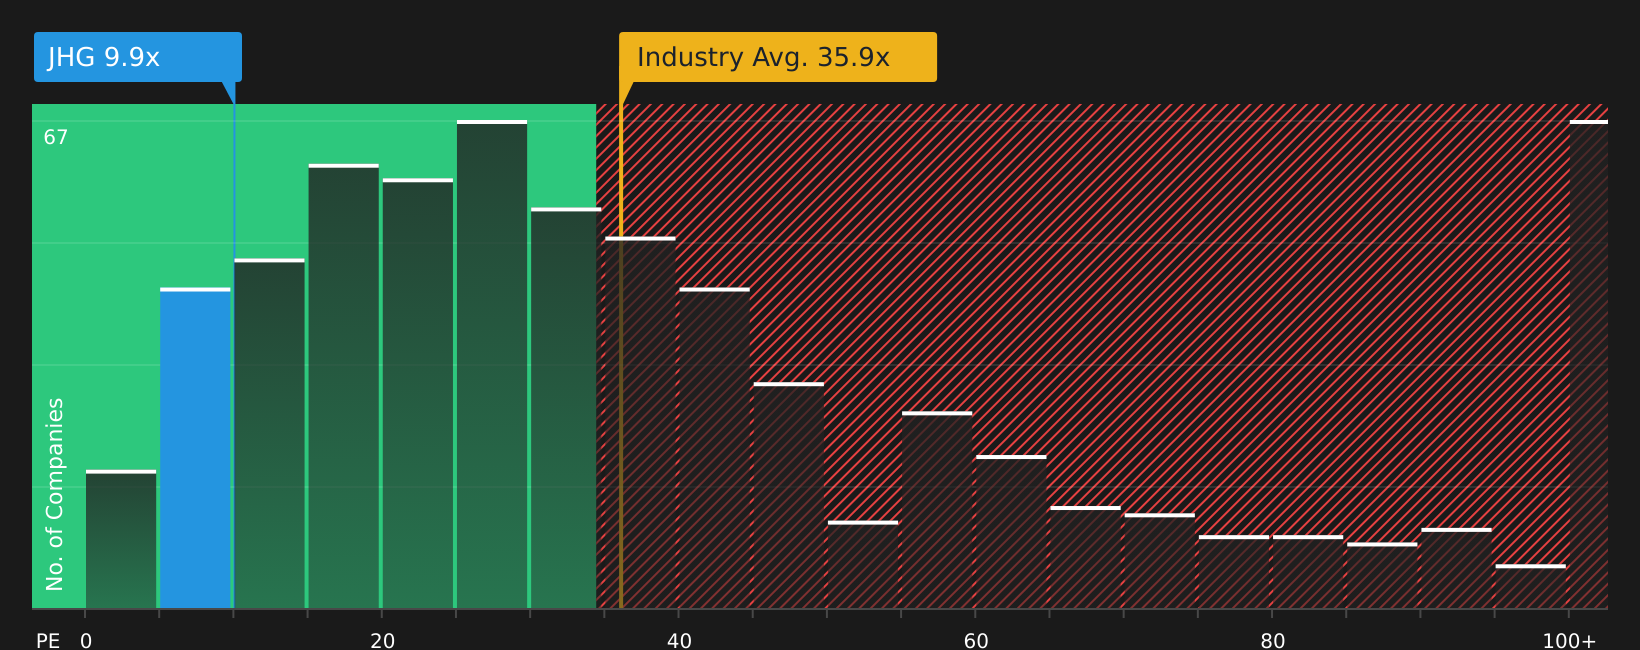
Janus Henderson Group trades on a P/E of 9.30x. This sits below the Capital Markets industry average of 22.85x and also below the peer average of 16.43x. Simply Wall St’s Fair Ratio for Janus Henderson Group is 13.79x. This Fair Ratio is a proprietary estimate of what the P/E might be, after weighing factors such as earnings growth, profit margins, risk indicators, industry, and market cap.
Because it is tailored to the company’s specific profile, the Fair Ratio can be more informative than a simple comparison with peers or the broader industry. With the current P/E of 9.30x sitting below the 13.79x Fair Ratio, this approach indicates that, based on earnings, the shares may be undervalued.
Result: UNDERVALUED
P/E ratios tell one story, but what if the real opportunity lies elsewhere? Start investing in legacies, not executives. Discover our 22 top founder-led companies.
Upgrade Your Decision Making: Choose your Janus Henderson Group Narrative
Earlier we mentioned that there is an even better way to understand valuation, so let us introduce you to Narratives, which are simply your story about a company linked directly to your numbers, such as your fair value, and your own expectations for future revenue, earnings and margins.
On Simply Wall St’s Community page, used by millions of investors, a Narrative connects three pieces in one place: what you think Janus Henderson Group is doing as a business, how that translates into a financial forecast, and what you believe is a fair value given those assumptions.
This makes decisions more concrete, because you can compare your Fair Value to today’s share price and decide whether that gap is wide enough for you to consider buying or selling. Your Narrative automatically updates when new information like results or news is added to the platform, so your view stays current without extra effort.
For Janus Henderson Group, one investor might build a Narrative that implies a fair value well below the current price, while another might set a fair value well above it. Seeing those different stories side by side can help you decide which assumptions feel more realistic for you.
Do you think there's more to the story for Janus Henderson Group? Head over to our Community to see what others are saying!
This article by Simply Wall St is general in nature. We provide commentary based on historical data and analyst forecasts only using an unbiased methodology and our articles are not intended to be financial advice. It does not constitute a recommendation to buy or sell any stock, and does not take account of your objectives, or your financial situation. We aim to bring you long-term focused analysis driven by fundamental data. Note that our analysis may not factor in the latest price-sensitive company announcements or qualitative material. Simply Wall St has no position in any stocks mentioned.