Is Jefferies Financial Group (JEF) Fully Valued Following Q2 Earnings Hopes And UBS Rating Change?
Jefferies Financial Group Inc. JEF | 0.00 |
Jefferies Financial Group (JEF) heads into its Q2 2026 earnings release after the market closes on June 24, with investors also reacting to a recent UBS rating change ahead of the announcement.
Despite Jefferies Financial Group’s recent 1 day share price decline of 3.65% to US$60.52 and a softer 7 day share price return, momentum over the past 30 and 90 days remains strong, while multi year total shareholder returns above 100% highlight how the longer term story has rewarded patient holders.
If you are looking beyond Jefferies Financial Group for what could be moving next in financial markets, this is a good moment to scan 20 top founder-led companies
With Jefferies Financial Group trading close to its analyst price target and expectations for Q2 already high, the key question is whether recent strength leaves limited upside or whether the stock still reflects untapped future growth potential.
Preferred P/E of 18.7x: Is it justified?
On current numbers, Jefferies Financial Group trades on a P/E of 18.7x, which suggests the stock is priced at a higher level than some peers and the internal fair ratio benchmark, even though it sits below the broader US Capital Markets industry average.
The P/E multiple compares the company’s share price to its earnings per share, so a higher P/E generally reflects the market paying more today for each dollar of earnings. For a firm like Jefferies Financial Group that operates across investment banking, capital markets and asset management, this often embeds expectations around deal activity, trading volumes and the stability of fee based revenue.
Here, the market is assigning Jefferies Financial Group a P/E of 18.7x, which is above the peer average of 16.5x and also above the estimated fair P/E of 16.7x. That suggests investors are currently paying a premium multiple compared to both similar companies and the level the fair ratio indicates the market could move toward if expectations were to cool.
Against the wider US Capital Markets industry, Jefferies Financial Group’s 18.7x P/E sits well below the industry average of 40.5x, which is a much richer valuation level. This split picture means the stock looks relatively inexpensive versus the overall industry but more expensive versus closer peers and its own fair P/E marker, which may matter more when comparing like for like.
Result: Price-to-Earnings of 18.7x (OVERVALUED)
However, Jefferies Financial Group’s recent share price gains and P/E premium could face pressure if deal activity softens or if analyst expectations around Q2 earnings prove too optimistic.
Another View: What the SWS DCF Model Says
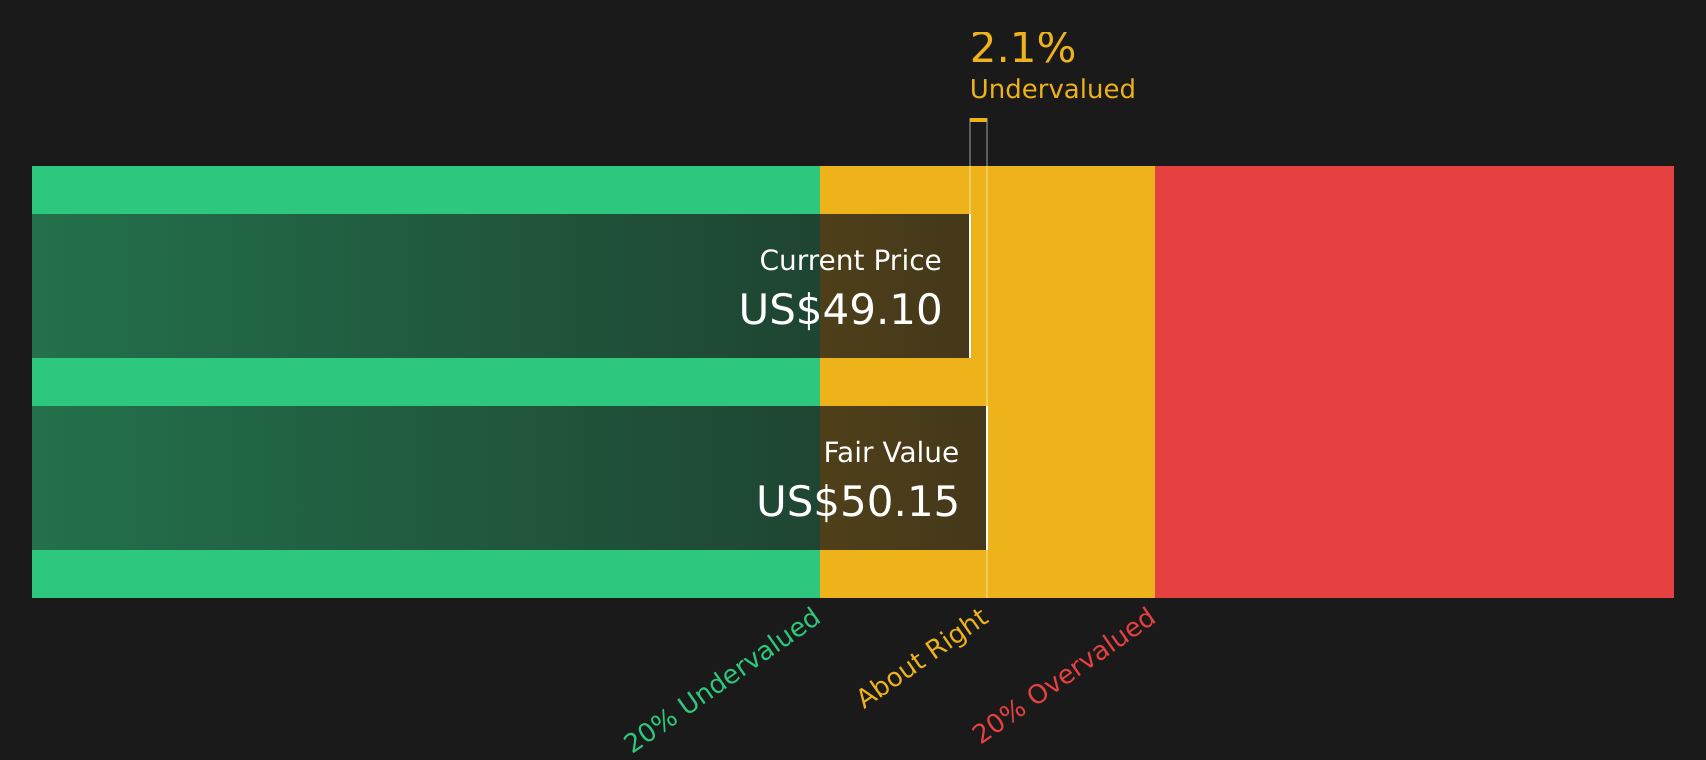
While the P/E premium hints at Jefferies Financial Group being priced on the expensive side, the SWS DCF model goes further, with an estimated future cash flow value of $48.36 versus the current $60.52 share price, pointing to an overvalued signal on this framework.
That gap leaves investors weighing how much confidence to place in earnings based multiples versus long run cash flow assumptions, and which story feels more realistic for Jefferies Financial Group right now.
Simply Wall St performs a discounted cash flow (DCF) on every stock in the world every day (check out Jefferies Financial Group for example). We show the entire calculation in full. You can track the result in your watchlist or portfolio and be alerted when this changes, or use our stock screener to discover 44 high quality undervalued stocks. If you save a screener we even alert you when new companies match - so you never miss a potential opportunity.
Next Steps
With Jefferies Financial Group showing both potential rewards and flagged risks, it makes sense to move quickly, review the numbers for yourself, and weigh the trade offs using the 2 key rewards and 1 important warning sign.
Looking for more investment ideas beyond Jefferies Financial Group?
Once you have assessed Jefferies Financial Group, do not stop there. The best opportunities often appear when you compare it against a broader range of well filtered stocks.
- Spot potential bargains early by scanning screener containing 19 high quality undiscovered gems that combine strong fundamentals with limited market attention.
- Strengthen capital protection by reviewing 67 resilient stocks with low risk scores that score well on resilience and risk controls.
- Build a steadier income stream by checking 7 dividend fortresses focused on higher yielding companies with durable payout profiles.
This article by Simply Wall St is general in nature. We provide commentary based on historical data and analyst forecasts only using an unbiased methodology and our articles are not intended to be financial advice. It does not constitute a recommendation to buy or sell any stock, and does not take account of your objectives, or your financial situation. We aim to bring you long-term focused analysis driven by fundamental data. Note that our analysis may not factor in the latest price-sensitive company announcements or qualitative material. Simply Wall St has no position in any stocks mentioned.