Is JetBlue Airways (JBLU) Now Attractive After Recent Share Price Rebound?
JetBlue Airways Corporation JBLU | 4.52 | -0.66% |
- Wondering if JetBlue Airways at around US$5.96 is a bargain or a value trap? This article walks through what the current price really reflects.
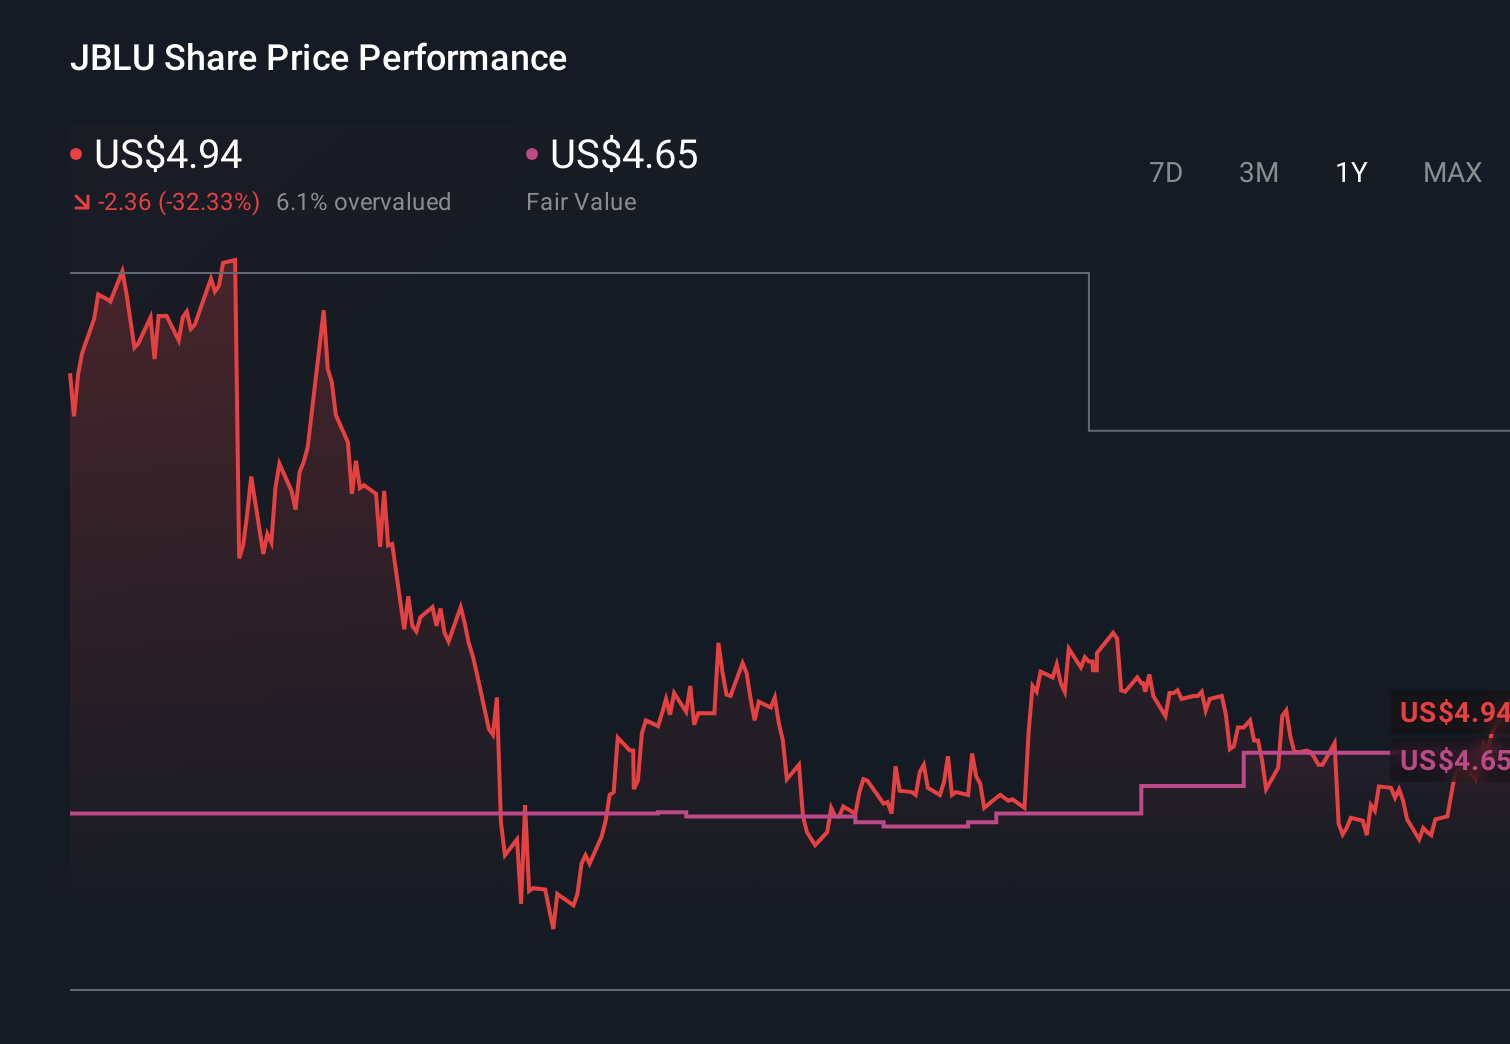
- The stock has returned 18.3% over the last 7 days and 24.2% over the last 30 days, while the 1 year return is a 2.6% decline and the 5 year return is a 64.2% decline. This mix can change how investors think about both risk and potential reward.
- Recent coverage has focused on JetBlue's ongoing efforts to reshape its route network and cost base, as well as regulatory and competitive pressures that affect how investors view US airlines. These themes help explain why the share price has moved sharply in the short term while longer term returns remain weak.
- On our framework, JetBlue Airways scores 5 out of 6 on the valuation checks. Next we will look at what different methods suggest about fair value and then finish with a way of assessing valuation that can add even more context for you as a shareholder or potential investor.
Approach 1: JetBlue Airways Discounted Cash Flow (DCF) Analysis
A Discounted Cash Flow, or DCF, model estimates what a company might be worth today by projecting its future cash flows and then discounting those back to a present value.
For JetBlue Airways, the model used here is a 2 Stage Free Cash Flow to Equity approach, based on cash flow projections in $. The latest twelve month free cash flow is a loss of about $1.44b. Analyst inputs only extend a few years, so Simply Wall St extrapolates further out, with projected free cash flow of $87.5 million in 2028 and then continuing projections through 2035.
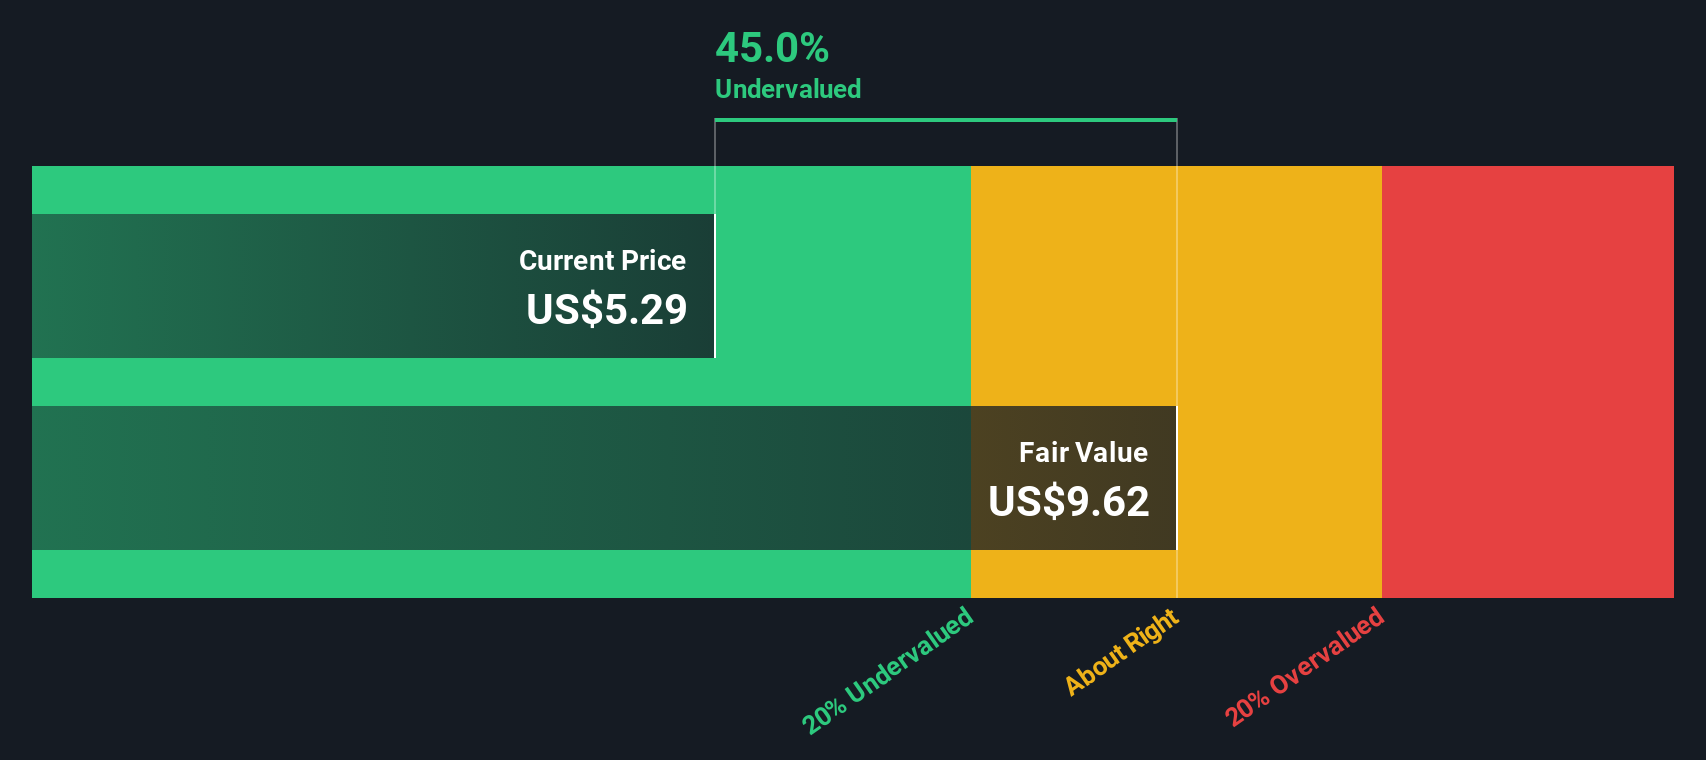
When all those projected cash flows are discounted back and combined, the model arrives at an intrinsic value of about US$10.28 per share. Compared with the current share price of about US$5.96, this suggests the stock is roughly 42.0% undervalued according to this DCF.
Result: UNDERVALUED
Our Discounted Cash Flow (DCF) analysis suggests JetBlue Airways is undervalued by 42.0%. Track this in your watchlist or portfolio, or discover 863 more undervalued stocks based on cash flows.
Approach 2: JetBlue Airways Price vs Sales
For companies where earnings are weak or volatile, price based on sales is often more useful than P/E because it looks at what investors are paying for each dollar of revenue rather than profit that can swing around year to year.
In simple terms, higher growth and lower risk usually justify a higher “normal” or “fair” valuation multiple, while slower growth and higher risk tend to pull that multiple down.
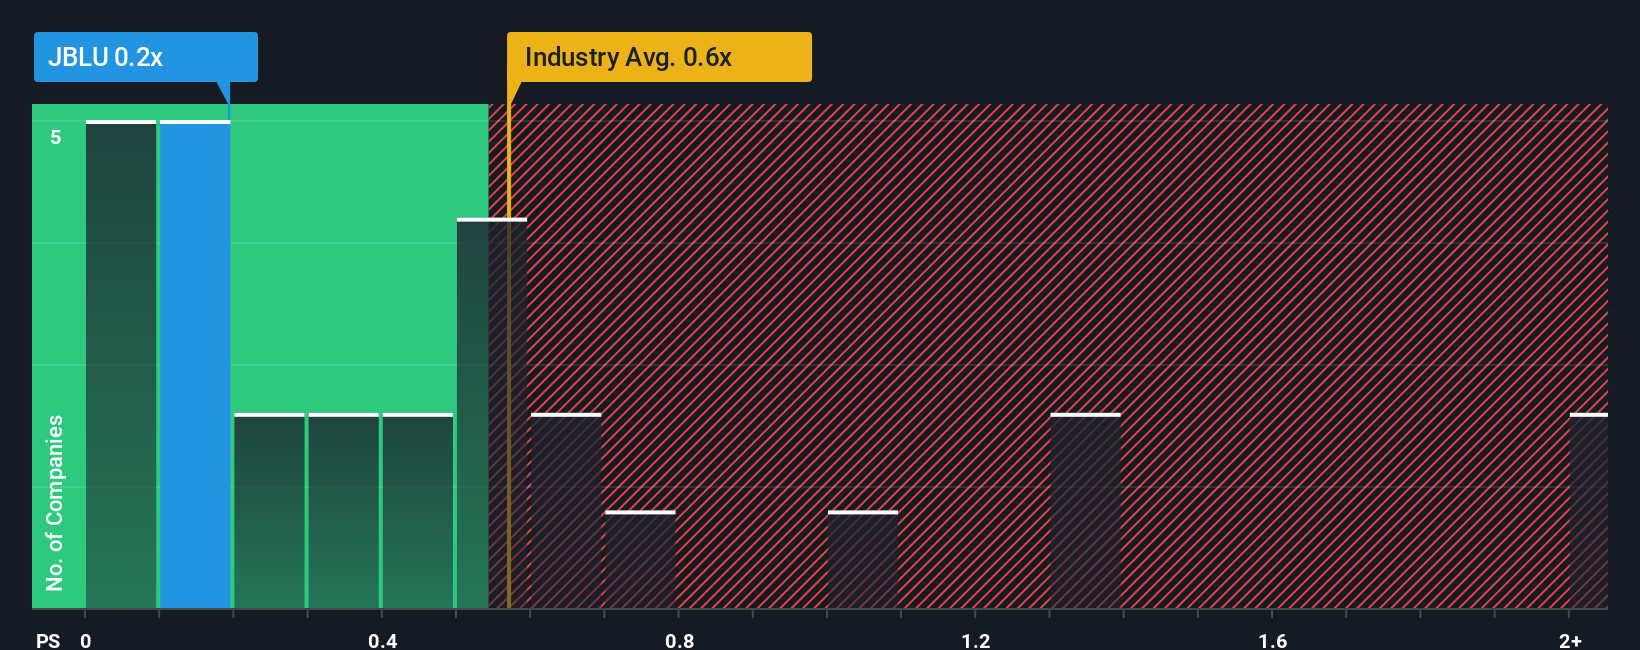
JetBlue Airways currently trades on a P/S ratio of about 0.24x. That sits below the Airlines industry average P/S of about 0.66x and also below the peer average of about 0.62x, which suggests the market is pricing JetBlue’s revenue more cautiously than many competitors.
Simply Wall St’s Fair Ratio for JetBlue is 0.76x. This is a proprietary estimate of what JetBlue’s P/S might be expected to look like given factors such as its earnings growth profile, profit margins, industry, market cap and company specific risks.
Because the Fair Ratio folds these company specific drivers into one number, it can give you a more tailored view than a simple comparison with peers or an industry average.
Putting that together, JetBlue’s actual P/S of 0.24x sits below the Fair Ratio of 0.76x, which indicates that the shares may be trading at a discount on this metric.
Result: POTENTIALLY UNDERVALUED ON P/S
P/S ratios tell one story, but what if the real opportunity lies elsewhere? Discover 1432 companies where insiders are betting big on explosive growth.
Upgrade Your Decision Making: Choose your JetBlue Airways Narrative
Earlier we mentioned that there is an even better way to understand valuation, so let us introduce you to Narratives, which are simply the stories you believe about a company linked directly to numbers like your own assumptions for fair value, future revenue, earnings and profit margins.
On Simply Wall St, Narratives sit inside the Community page and give you an easy way to connect a company’s story to a financial forecast and then to a fair value that you can compare with the current share price.
That comparison of Fair Value versus Price helps you decide whether you see JetBlue Airways as worth accumulating, holding or potentially trimming. The Narrative you choose automatically updates when fresh news or earnings data is added to the platform so your view never goes stale.
For example, one JetBlue Airways Narrative on the Community page might reflect a very optimistic fair value with stronger long term margins, while another uses much more cautious assumptions and a lower fair value, showing how two investors can look at the same stock and reach very different conclusions.
Do you think there's more to the story for JetBlue Airways? Head over to our Community to see what others are saying!
This article by Simply Wall St is general in nature. We provide commentary based on historical data and analyst forecasts only using an unbiased methodology and our articles are not intended to be financial advice. It does not constitute a recommendation to buy or sell any stock, and does not take account of your objectives, or your financial situation. We aim to bring you long-term focused analysis driven by fundamental data. Note that our analysis may not factor in the latest price-sensitive company announcements or qualitative material. Simply Wall St has no position in any stocks mentioned.