Is KKR (KKR) Still Attractive After Recent Share Price Weakness?
KKR & Co Inc Class A KKR | 91.23 | -0.14% |
- Wondering if KKR at around US$123 a share is a bargain or just expensive hype? This article walks you through what the current price might really be telling you about value.
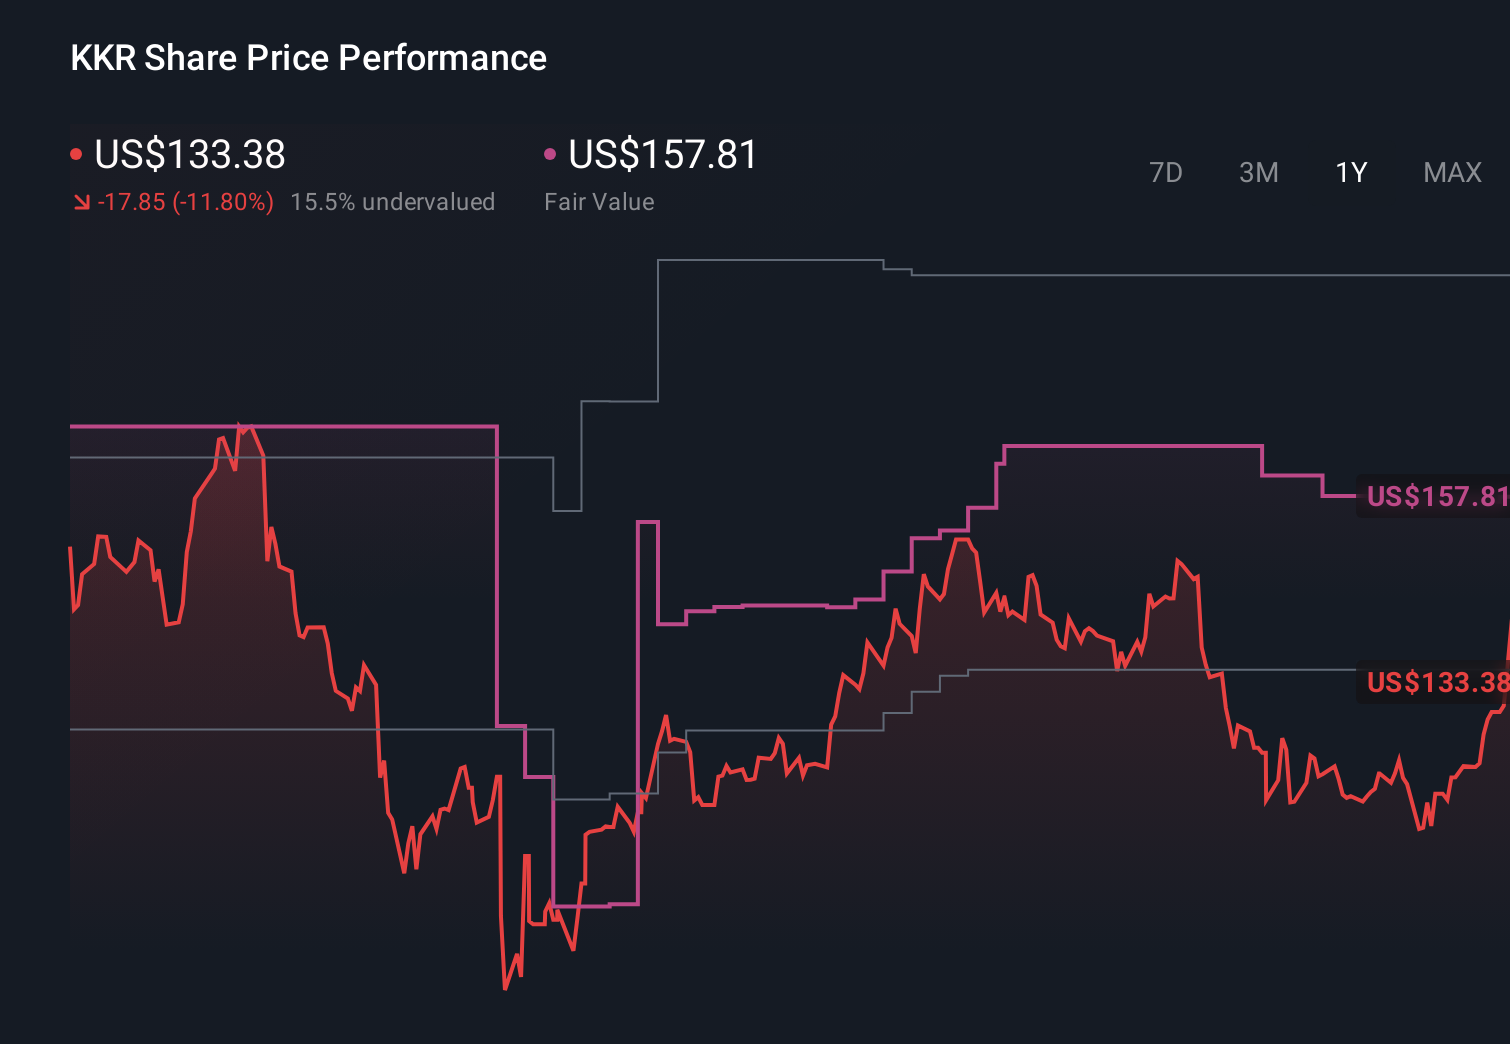
- The stock has seen a 6% decline over the last 7 days, a 5.7% decline over 30 days and a 4.2% decline year to date, while the 1 year return sits at a 24.9% decline against much stronger 3 year and 5 year returns of 128.4% and 231.4% respectively.
- These swings have come alongside ongoing attention on KKR as a major name in alternative assets and capital markets. This keeps investor expectations and sentiment in focus. Broader debates about interest rates, credit conditions and deal activity also feed into how investors think about the value of firms like KKR, even without a single headline driving the recent moves.
- Our valuation model gives KKR a 1 out of 6 valuation score. Next we will break down what different methods say about the current price, and then finish by looking at a more complete way to think about valuation that brings all these signals together.
KKR scores just 1/6 on our valuation checks. See what other red flags we found in the full valuation breakdown.
Approach 1: KKR Excess Returns Analysis
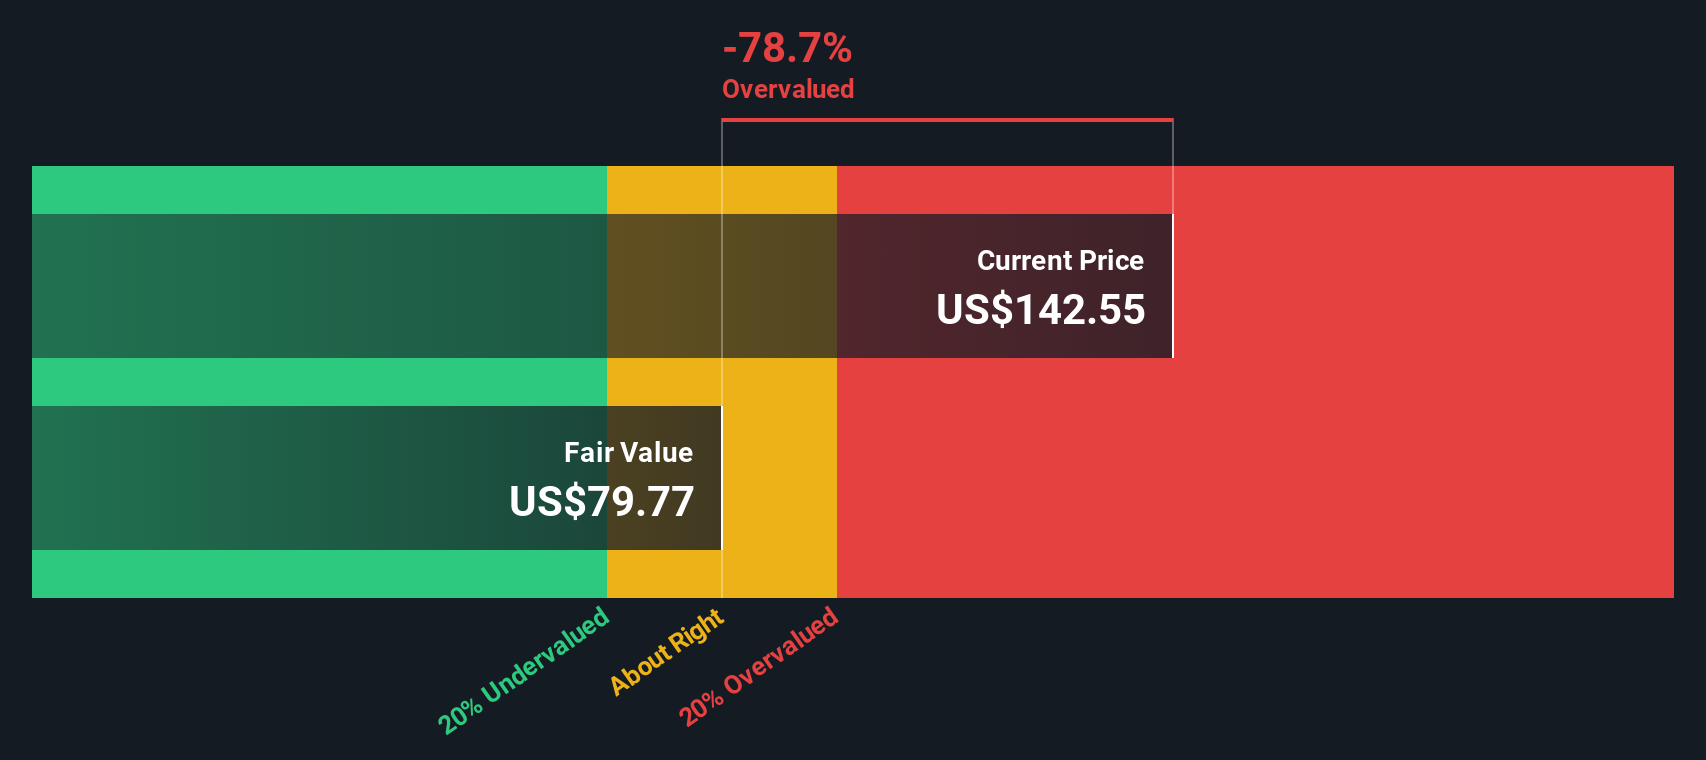
The Excess Returns model looks at how much profit KKR is expected to earn on its equity above the return that shareholders require, then converts that stream of “extra” earnings into a value per share.
For KKR, the model uses a Book Value of $30.54 per share and a Stable EPS estimate of $7.57 per share, based on weighted future Return on Equity estimates from 7 analysts. The Average Return on Equity used is 11.19%, with a Cost of Equity of $6.32 per share. That gap produces an Excess Return of $1.25 per share, which is essentially the estimated profit above investors’ required return.
The model also assumes a Stable Book Value of $67.66 per share, sourced from weighted future Book Value estimates from 4 analysts. Putting these pieces together, the Excess Returns calculation points to an intrinsic value of about $88.24 per share.
Compared with a share price of around $123, this method implies the stock is roughly 39.9% overvalued.
Result: OVERVALUED
Our Excess Returns analysis suggests KKR may be overvalued by 39.9%. Discover 881 undervalued stocks or create your own screener to find better value opportunities.
Approach 2: KKR Price vs Earnings
For a profitable business like KKR, the P/E ratio is a useful shorthand because it links what you pay today to the earnings the company is already generating. Investors often look for a “normal” P/E that reflects what they think is reasonable given the company’s growth outlook and the risk they are taking on, with higher growth and lower perceived risk usually supporting a higher multiple.
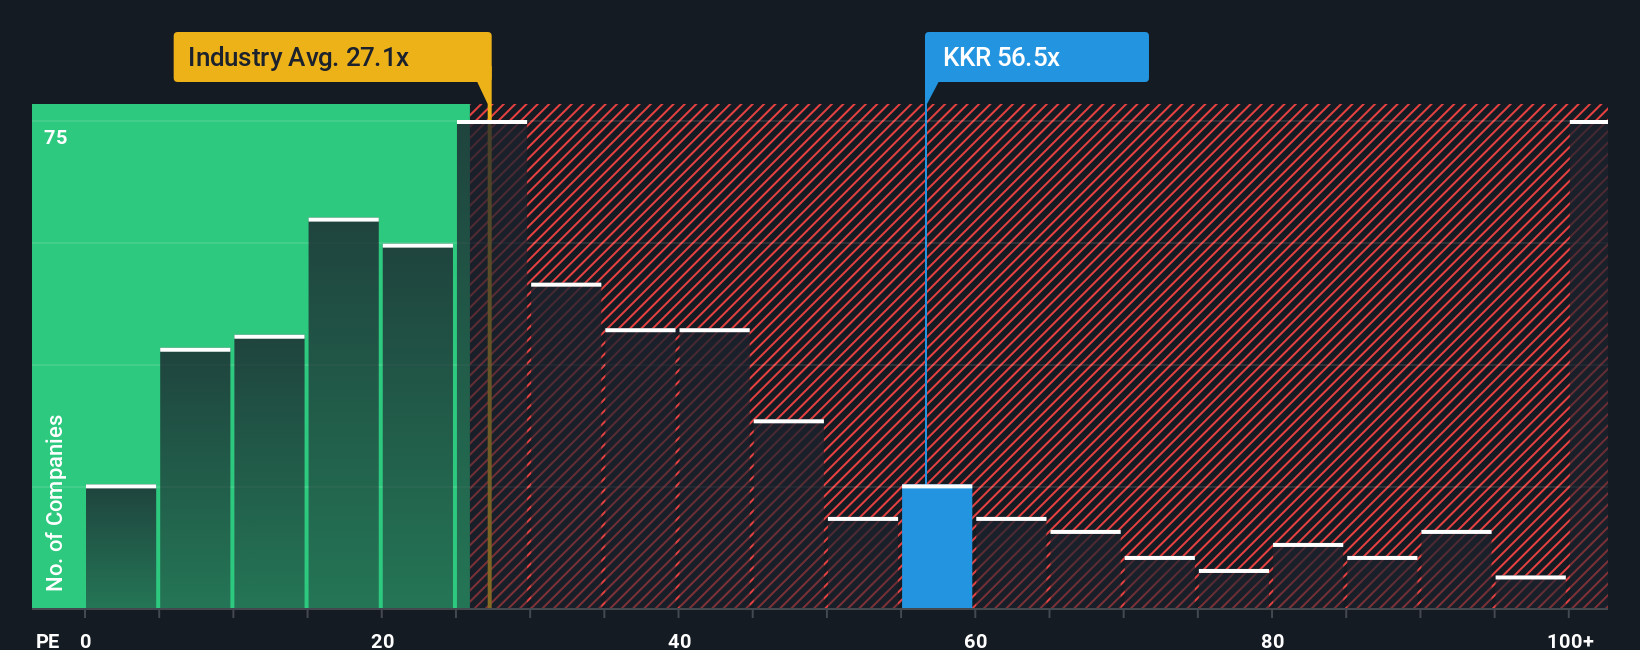
KKR currently trades on a P/E of 48.44x. That sits above both the Capital Markets industry average of 25.81x and the peer group average of 37.04x, which on a simple comparison can make the stock look expensive. However, these basic comparisons do not adjust for company specific traits.
Simply Wall St’s Fair Ratio for KKR is 26.12x, which is its proprietary view of what a more tailored P/E might look like after considering factors such as earnings growth, profit margins, industry, market cap and risk profile. Because it blends all of these into one figure, the Fair Ratio can be more informative than a straight peer or industry comparison. Lining up the Fair Ratio of 26.12x against the current 48.44x suggests KKR is trading above this inferred fair level.
Result: OVERVALUED
P/E ratios tell one story, but what if the real opportunity lies elsewhere? Discover 1429 companies where insiders are betting big on explosive growth.
Upgrade Your Decision Making: Choose your KKR Narrative
Earlier we mentioned that there is an even better way to think about valuation, so let us introduce you to Narratives. These are hosted on the Simply Wall St Community page, which is used by millions of investors.
A Narrative is your story about a company, written in numbers, where you link your view of its future revenue, earnings and margins to a clear fair value estimate instead of relying only on headline ratios like the P/E.
Each Narrative connects three pieces: the business story you believe, the financial forecast that follows from that story, and the fair value that falls out of those assumptions. It then compares that fair value with the current share price to help you decide whether you see KKR as priced attractively or not right now.
Because Narratives on Simply Wall St update as new data arrives, such as fresh earnings or major news, you can see how your view stacks up against others. For example, one KKR Narrative recently set a much higher fair value than another that used more cautious growth and profitability assumptions.
Do you think there's more to the story for KKR? Head over to our Community to see what others are saying!
This article by Simply Wall St is general in nature. We provide commentary based on historical data and analyst forecasts only using an unbiased methodology and our articles are not intended to be financial advice. It does not constitute a recommendation to buy or sell any stock, and does not take account of your objectives, or your financial situation. We aim to bring you long-term focused analysis driven by fundamental data. Note that our analysis may not factor in the latest price-sensitive company announcements or qualitative material. Simply Wall St has no position in any stocks mentioned.