Is Kohl's (KSS) Recent 76% Rally Supported By Its Current Valuation Metrics
Kohl's Corporation KSS | 12.82 | -0.47% |
- If you are wondering whether Kohl's current share price reflects its true value, you are not alone. This article will focus squarely on what the numbers say about the stock.
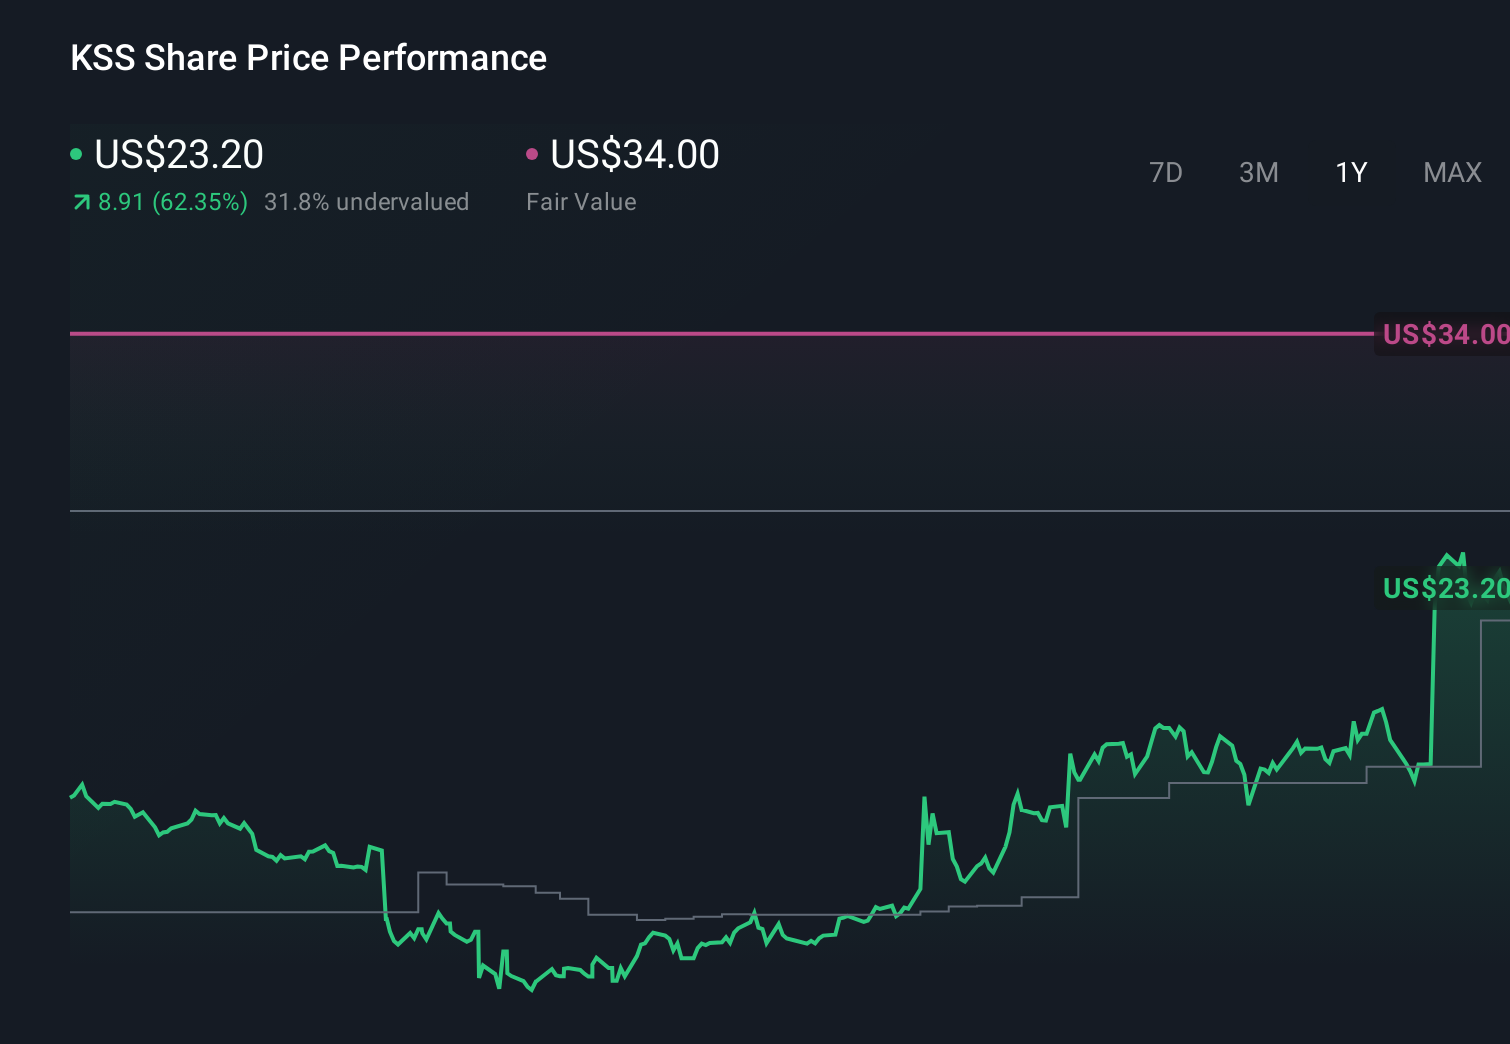
- The share price last closed at US$19.85, with returns of 7.3% over the past week, 2.8% over the past month, a 7.0% decline year to date, and a 76.5% return over the past year that contrasts with weaker 3 and 5 year returns of 23.1% and 49.1% declines.
- Recent headlines around Kohl's have included ongoing scrutiny of its turnaround efforts, commentary on its position in the competitive US department store space, and market reactions to updates on its business initiatives. Together, these stories have shaped how investors are thinking about both the risks and potential for the retailer.
- Kohl's currently has a valuation score of 5 out of 6. This raises an important question about how different valuation methods, and an even more complete view later in this article, might help you judge whether that score lines up with your own view of fair value.
Approach 1: Kohl's Discounted Cash Flow (DCF) Analysis
A Discounted Cash Flow, or DCF, model estimates what a business could be worth by projecting its future cash flows and then discounting those back into today’s dollars.
For Kohl's, the model uses last twelve months free cash flow of about $771.8 million as a starting point, then applies a 2 Stage Free Cash Flow to Equity approach based on cash flow projections. Analyst inputs run through 2028, with Simply Wall St extrapolating further estimates. By 2035, the projection used in the model is free cash flow of about $883.1 million, all expressed in US$.
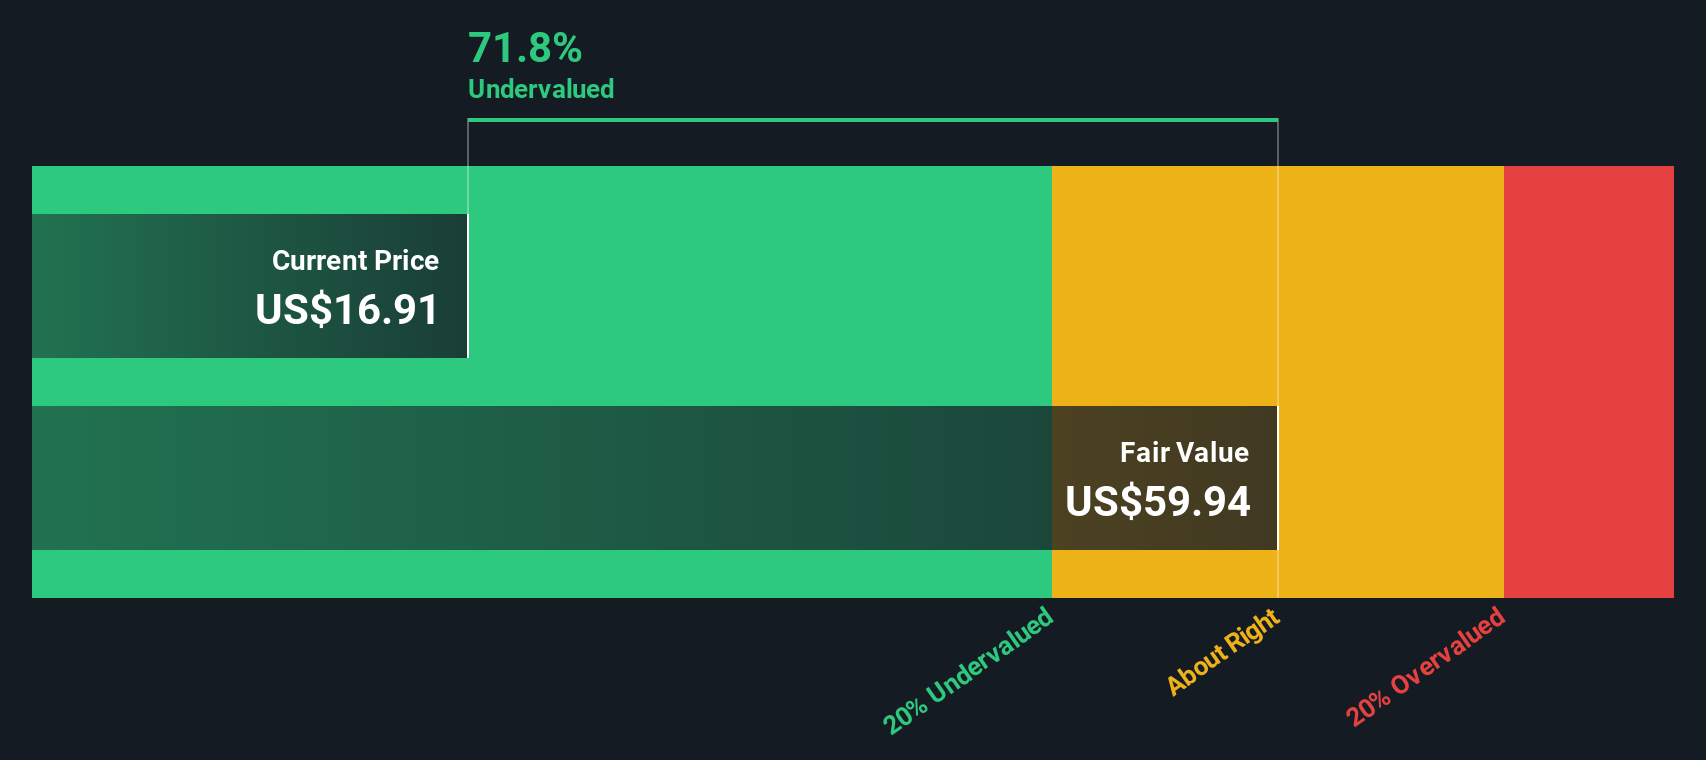
Bringing those projected cash flows back to today gives an estimated intrinsic value of $67.11 per share, compared with the recent share price of $19.85. On this basis, the DCF output suggests Kohl's may be about 70.4% undervalued.
Result: UNDERVALUED
Our Discounted Cash Flow (DCF) analysis suggests Kohl's is undervalued by 70.4%. Track this in your watchlist or portfolio, or discover 53 more high quality undervalued stocks.
Approach 2: Kohl's Price vs Earnings
For profitable companies, the P/E ratio is a useful way to see how much you are paying for each dollar of earnings, which makes it a practical cross check against the DCF output you saw earlier.
What counts as a normal or fair P/E usually reflects how the market views a company’s growth prospects and risk profile. Higher expected growth or lower perceived risk can justify a higher P/E, while slower growth or higher risk often point to a lower one.
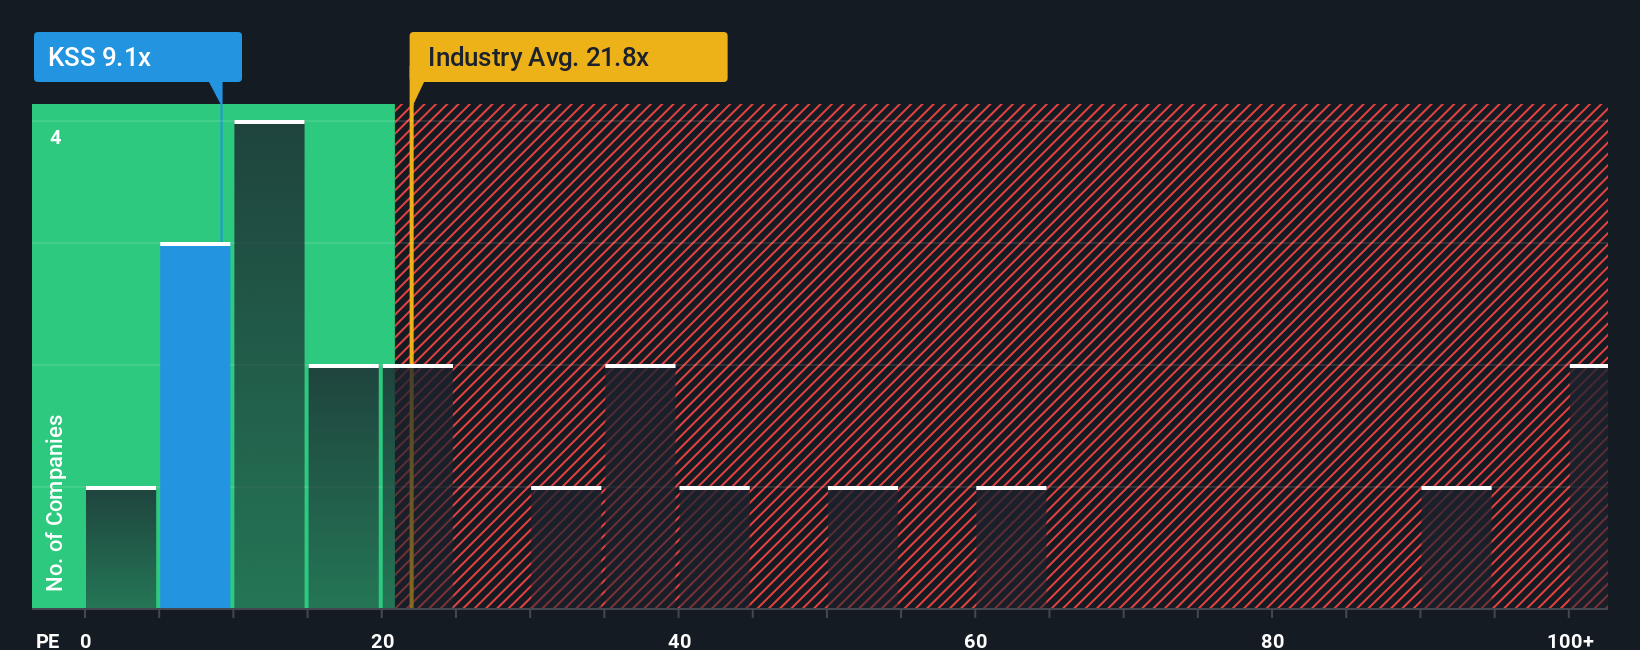
Kohl's currently trades on a P/E of about 11.4x. That sits below both the Multiline Retail industry average of roughly 19.4x and the peer average of 19.1x, so on simple comparisons the shares are priced at a lower multiple than many peers.
Simply Wall St also calculates a Fair Ratio of 19.6x for Kohl's. This is a proprietary P/E benchmark that aims to reflect the company’s own earnings growth profile, its industry, profit margins, market cap and specific risks, which can make it more tailored than using broad peer or industry averages alone.
Comparing that Fair Ratio of 19.6x with the actual P/E of 11.4x suggests Kohl's shares are trading below what this framework would imply.
Result: UNDERVALUED
P/E ratios tell one story, but what if the real opportunity lies elsewhere? Start investing in legacies, not executives. Discover our 23 top founder-led companies.
Upgrade Your Decision Making: Choose your Kohl's Narrative
Earlier we mentioned that there is an even better way to understand valuation, so let us introduce you to Narratives, which are simply your story about a company linked directly to your assumptions for its future revenue, earnings, margins and fair value.
On Simply Wall St, Narratives live on the Community page and let you connect the dots from a clear thesis, to a financial forecast, to a fair value estimate. You can then compare that fair value with the current share price to help inform when you might want to buy or sell.
They are updated automatically when new information such as results or news is added. This means you always see how fresh developments could affect your story and the valuation that flows from it.
For Kohl's, one investor Narrative on the platform might anchor on a long term fair value of about US$34 per share, while another might use a much lower fair value closer to US$4. Seeing those side by side shows you how different assumptions about the same company can lead to very different conclusions.
For Kohl's, we will make it really easy for you with previews of two leading Kohl's Narratives:
Fair value in this Narrative: US$34.00 per share
Implied discount to this fair value at US$19.85: about 41.6% undervalued
Revenue growth assumption: 48.01%
- Argues that the share price is reflecting bankruptcy style expectations even though the company reports sizable free cash flow, declining debt and owns substantial real estate assets.
- Views lease liabilities as less binding than traditional debt and highlights that reported net debt figures may be obscuring the equity value tied up in property.
- Frames the current price as significantly below book value and even a conservative historical multiple, with the author seeing long term value closer to the US$34 per share book value.
Fair value in this Narrative: US$4.00 per share
Implied downside to this fair value at US$19.85: about 396.3% overvalued
Revenue growth assumption: 4.35% decline
- Emphasises structural pressure on store traffic from e commerce, changing consumer habits and weaker demand in core categories like apparel and home.
- Points to rising costs, limited merchandise differentiation and industry consolidation as forces that could compress margins and cap long term earnings power.
- Bases a US$4.00 target on analyst assumptions for revenue, margins and a future P/E of 3.0x, and encourages readers to test whether those expectations align with their own view of Kohl's prospects.
These two Narratives sit at very different ends of the spectrum, which is exactly why they are useful. They give you concrete numbers on fair value, revenue and margins, then leave room for you to decide which set of assumptions feels closer to how you see Kohl's business today.
If you want to see how other investors are framing the story, or build your own version with your assumptions for future earnings and fair value, Curious how numbers become stories that shape markets? Explore Community Narratives.
Do you think there's more to the story for Kohl's? Head over to our Community to see what others are saying!
This article by Simply Wall St is general in nature. We provide commentary based on historical data and analyst forecasts only using an unbiased methodology and our articles are not intended to be financial advice. It does not constitute a recommendation to buy or sell any stock, and does not take account of your objectives, or your financial situation. We aim to bring you long-term focused analysis driven by fundamental data. Note that our analysis may not factor in the latest price-sensitive company announcements or qualitative material. Simply Wall St has no position in any stocks mentioned.