Is Kosmos Energy (KOS) Still Attractively Priced After Its Recent Share Price Surge
Kosmos Energy Ltd. KOS | 2.92 | +8.55% |
- If you are wondering whether Kosmos Energy is still attractively priced after recent moves, this article walks through what the numbers actually say about its current value.
- The stock last closed at US$2.09, with returns of 22.9% over the past week, 64.6% over the past month and 134.1% year to date, while the 1 year, 3 year and 5 year returns stand at 21.1% decline, 72.9% decline and 35.9% decline respectively.
- Recent price action has come alongside ongoing investor interest in the US energy sector and company specific developments that continue to keep Kosmos Energy on watchlists. This context matters because sentiment, funding conditions and asset based news can all influence how the market weighs the stock against its fundamentals.
- On our valuation checks, Kosmos Energy records a score of 5 out of 6. Next we will look at how different valuation methods assess the shares and then finish with a more complete way to think about what this valuation really means for you.
Approach 1: Kosmos Energy Discounted Cash Flow (DCF) Analysis
A Discounted Cash Flow, or DCF, model takes estimates of the cash a business could generate in the future and discounts those back to what they might be worth in today’s dollars, then compares that to the current share price.
For Kosmos Energy, the model used here is a 2 Stage Free Cash Flow to Equity approach. The latest twelve month free cash flow is a loss of about US$396.7 million, so the valuation leans heavily on what the company might generate going forward rather than what it has just reported.
Analyst and extrapolated projections, provided in the model, show annual free cash flow estimates such as US$337.3 million in 2026 and US$212 million in 2028, with further projected values through to 2035. These cash flows are discounted back to today using the DCF framework to arrive at an estimated intrinsic value of about US$6.87 per share.
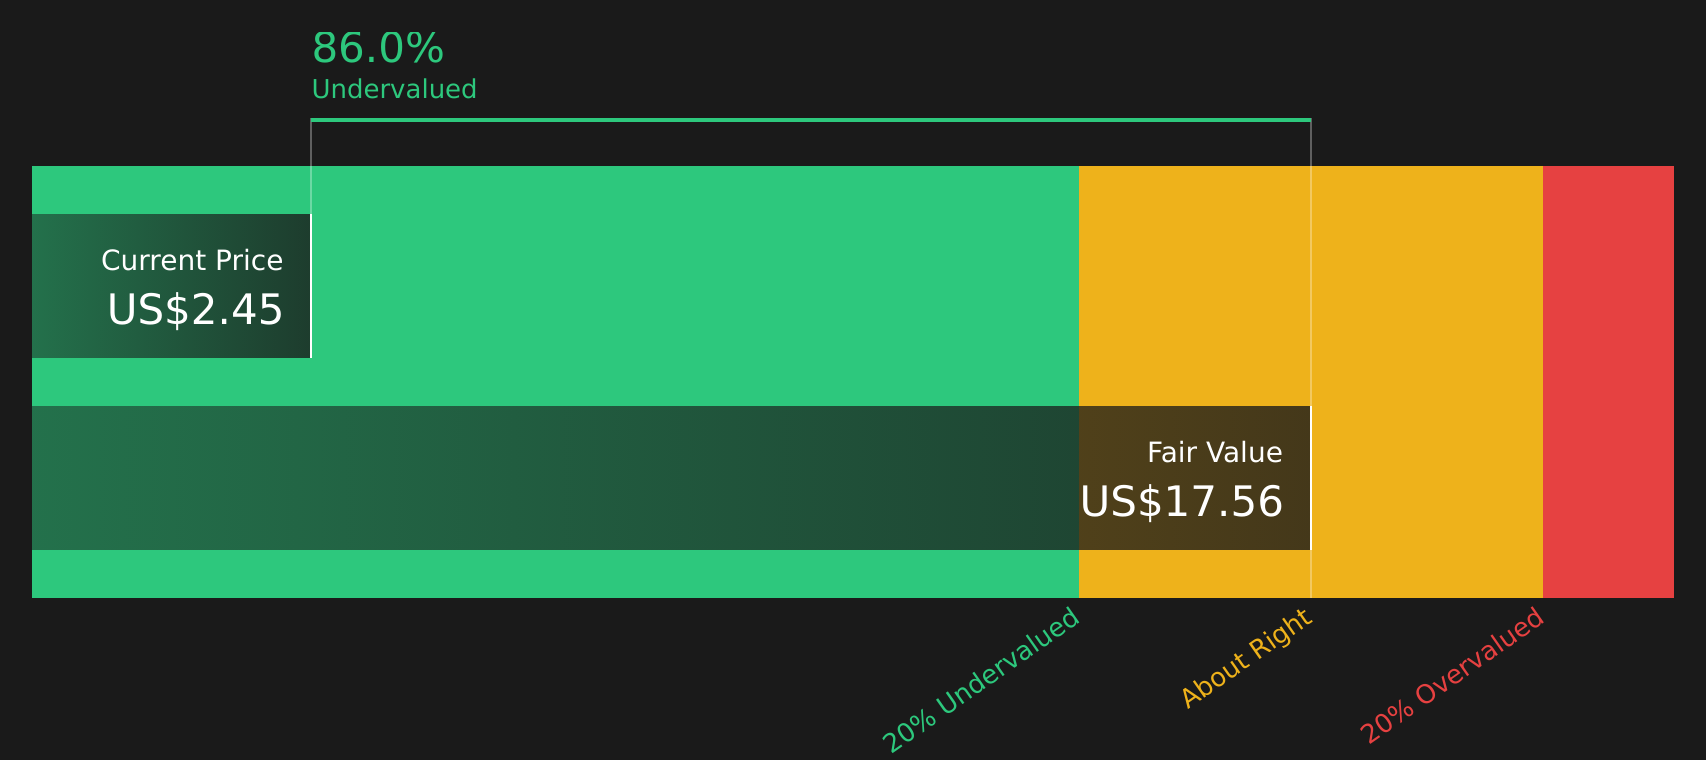
Against the recent share price of US$2.09, the DCF output suggests the stock trades at a 69.6% discount to this intrinsic estimate. On this model alone, the shares appear to be undervalued.
Result: UNDERVALUED
Our Discounted Cash Flow (DCF) analysis suggests Kosmos Energy is undervalued by 69.6%. Track this in your watchlist or portfolio, or discover 53 more high quality undervalued stocks.
Approach 2: Kosmos Energy Price vs Sales
For companies where earnings are not a clean guide, the P/S ratio is often a useful way to think about value because it compares what you pay for each dollar of revenue, rather than profit that can swing with one off items or heavy investment.
What counts as a “normal” P/S depends on how quickly revenue is expected to grow and how risky that revenue stream is. Higher expected growth and lower perceived risk usually support a higher multiple, while slower or less certain growth tends to keep it lower.
Kosmos Energy currently trades on a P/S of 0.72x, compared with the Oil and Gas industry average of 1.69x and a peer average of 4.74x. Simply Wall St’s Fair Ratio for Kosmos is 1.17x. This Fair Ratio is a proprietary estimate of the multiple that might be reasonable given factors such as earnings growth, profit margins, industry, market cap and company specific risks, which makes it more tailored than a simple peer or industry comparison.
Against this 1.17x Fair Ratio, the current 0.72x P/S suggests the shares are undervalued on this metric.
Result: UNDERVALUED

P/S ratios tell one story, but what if the real opportunity lies elsewhere? Start investing in legacies, not executives. Discover our 21 top founder-led companies.
Upgrade Your Decision Making: Choose your Kosmos Energy Narrative
Earlier we mentioned that there is an even better way to understand valuation. Narratives let you connect your view of Kosmos Energy's story to concrete numbers by turning your assumptions about future revenue, earnings, margins and a fair value into a single, easy to follow framework on Simply Wall St's Community page. There you can compare a more cautious view that sets fair value around US$2.00 with a more optimistic view closer to US$6.86, see how each Narrative's fair value stacks up against the current share price when you are thinking about buying or selling, and watch those fair values update automatically as new earnings, news or guidance come through.
For Kosmos Energy, however, we’ll make it really easy for you with previews of two leading Kosmos Energy Narratives:
Fair value in this bull case narrative: US$2.10 per share
Implied discount to this fair value: about 0.5% relative to the last close of US$2.09
Implied annual revenue growth used in this narrative: 4.23%
- The narrative focuses on higher future LNG and oil production, using projects like GTA and Ghana licenses to support cash flow stability and earnings potential beyond 2025.
- It leans on geographic diversification across the Atlantic margin and ongoing cost control to support margins and free cash flow as capex rolls off.
- The view weighs these factors against risks from political exposure in West Africa, debt levels, industry regulation and the long term energy transition.
Fair value in this bear case narrative: US$2.00 per share
Implied premium to this fair value: about 4.5% relative to the last close of US$2.09
Implied annual revenue growth used in this narrative: 2.34% decline
- This narrative highlights reliance on fossil fuel demand and mature offshore assets, with a focus on how the global shift toward renewables could affect long term growth and profitability.
- It places more weight on geopolitical and operational risks in West Africa, along with higher leverage and ongoing refinancing needs that could affect financial flexibility.
- The bear view also discusses the possibility that higher carbon and regulatory costs, plus ESG driven capital pressures, could affect future project economics and sector valuation multiples.
If you want to go beyond the preview and see how other investors are joining these dots between numbers, risks and potential outcomes for Kosmos Energy, Curious how numbers become stories that shape markets? Explore Community Narratives.
Do you think there's more to the story for Kosmos Energy? Head over to our Community to see what others are saying!

This article by Simply Wall St is general in nature. We provide commentary based on historical data and analyst forecasts only using an unbiased methodology and our articles are not intended to be financial advice. It does not constitute a recommendation to buy or sell any stock, and does not take account of your objectives, or your financial situation. We aim to bring you long-term focused analysis driven by fundamental data. Note that our analysis may not factor in the latest price-sensitive company announcements or qualitative material. Simply Wall St has no position in any stocks mentioned.