Is Lennar (LEN) Balancing Index Exit and Dividends to Redefine Its Defensive Profile?
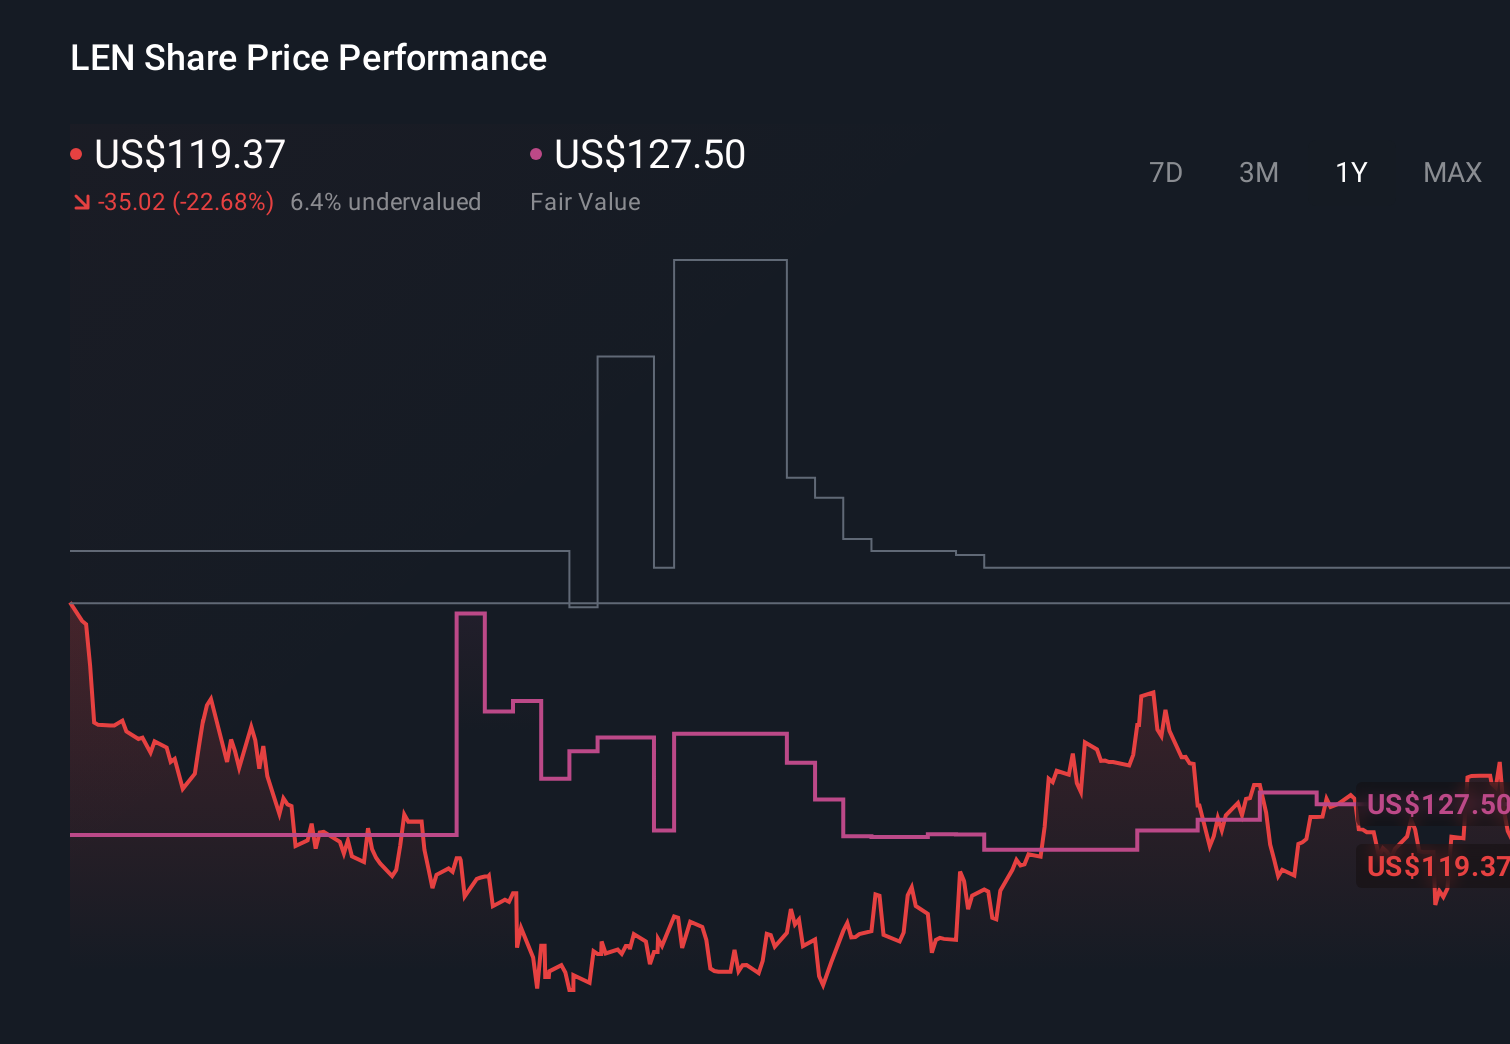
Lennar Corporation Class A LEN | 0.00 |
- Earlier this week, Lennar Corporation’s Class A and Class B shares were removed from several Russell 1000 Defensive and Value-Defensive indexes, shortly after its board affirmed a quarterly US$0.50 per share dividend payable on July 24, 2026 to holders of record on July 10, 2026.
- This combination of index deletions, which can drive passive fund rebalancing, and a steady dividend decision highlights how Lennar is being reassessed by both income-focused and index-tracking investors.
- We’ll now examine how Lennar’s removal from Russell 1000 Defensive and Value-Defensive indexes may influence the existing investment narrative.
Explore 30 top quantum computing companies leading the revolution in next-gen technology and shaping the future with breakthroughs in quantum algorithms, superconducting qubits, and cutting-edge research.
Lennar Investment Narrative Recap
To own Lennar, you generally have to believe that U.S. housing demand and homebuilder economics can support its asset light approach despite margin pressure from incentives and costs. The recent removal from Russell 1000 Defensive and Value Defensive indexes may prompt some short term passive selling, but it does not fundamentally change Lennar’s key near term catalyst of stabilizing earnings or its biggest risk around a prolonged period of higher mortgage rates and affordability constraints.
The reaffirmed quarterly US$0.50 per share dividend for both Class A and Class B stock stands out here. While index deletions could influence who holds the shares, a consistent dividend policy speaks more directly to income oriented investors who are weighing softer recent earnings against ongoing capital returns. How Lennar balances dividends, buybacks and reinvestment will be important if housing demand and margins remain under pressure.
Yet behind the steady dividend, one risk investors should be aware of is how prolonged incentives and weaker margins might interact with Lennar’s land light model...
Lennar's narrative projects $39.8 billion revenue and $1.7 billion earnings by 2029. This requires 6.8% yearly revenue growth and about a $0.1 billion earnings increase from $1.6 billion today.
Uncover how Lennar's forecasts yield a $88.54 fair value, a 5% downside to its current price.
Exploring Other Perspectives
Some of the most optimistic analysts were assuming roughly US$40.1 billion of revenue and about US$3.2 billion of earnings, yet index removal and margin pressure could make that upbeat path, and the idea that incentives will ultimately boost long term earnings power, look very different depending on how you view these new developments.
Explore 5 other fair value estimates on Lennar - why the stock might be worth as much as 39% more than the current price!
The Verdict Is Yours
Disagree with existing narratives? Extraordinary investment returns rarely come from following the herd, so go with your instincts.
- A great starting point for your Lennar research is our analysis highlighting 2 key rewards and 2 important warning signs that could impact your investment decision.
- Our free Lennar research report provides a comprehensive fundamental analysis summarized in a single visual - the Snowflake - making it easy to evaluate Lennar's overall financial health at a glance.
Interested In Other Possibilities?
Markets shift fast. These stocks won't stay hidden for long. Get the list while it matters:
- Uncover the next big thing with 21 elite penny stocks that balance risk and reward.
- The future of work is here. Discover the 29 top robotics and automation stocks leading the charge in AI-driven automation and industrial transformation.
- Invest in the nuclear renaissance through our list of 89 elite nuclear energy infrastructure plays powering the global AI revolution.
This article by Simply Wall St is general in nature. We provide commentary based on historical data and analyst forecasts only using an unbiased methodology and our articles are not intended to be financial advice. It does not constitute a recommendation to buy or sell any stock, and does not take account of your objectives, or your financial situation. We aim to bring you long-term focused analysis driven by fundamental data. Note that our analysis may not factor in the latest price-sensitive company announcements or qualitative material. Simply Wall St has no position in any stocks mentioned.