Is Lennar (LEN) Offering Value After Recent Housing Market Headlines And Mixed Returns?
Lennar Corporation Class A LEN | 0.00 |
- Investors may be wondering whether Lennar at around US$90.49 is offering value right now, or if the stock price already reflects the story they are buying into.
- The share price has inched up about 0.8% over the past week and 2.4% over the past month, while year to date it is down 13.2% and the 1 year return is a decline of 15.1%, with a 3 year decline of 10.2% and a 5 year gain of 14.0%.
- Recent headlines around Lennar have focused on the broader housing market backdrop and investor sentiment toward homebuilders, giving context to the mixed return profile investors see today. This mix of short term resilience alongside weaker longer term returns is keeping the question of fair value firmly in focus.
- Lennar currently has a valuation score of 4 / 6, which means it screens as undervalued on four of six checks. The sections that follow will walk through the main valuation approaches investors often use, before finishing with a way to think about value that goes beyond any single model.
Approach 1: Lennar Discounted Cash Flow (DCF) Analysis
A Discounted Cash Flow, or DCF, model estimates what a stock might be worth by projecting the company’s future cash flows and discounting them back to today’s value. It is essentially asking what future cash generated by the business is worth in today’s dollars.
For Lennar, the latest twelve month Free Cash Flow is a loss of about $82m. Analysts have provided Free Cash Flow estimates out to 2027, with Simply Wall St extending those forecasts further using its own assumptions. In this model, projected Free Cash Flow in 2035 is about $3.27b, with annual figures between 2026 and 2035 ranging from roughly $1.19b to $3.27b in nominal terms, all in $.
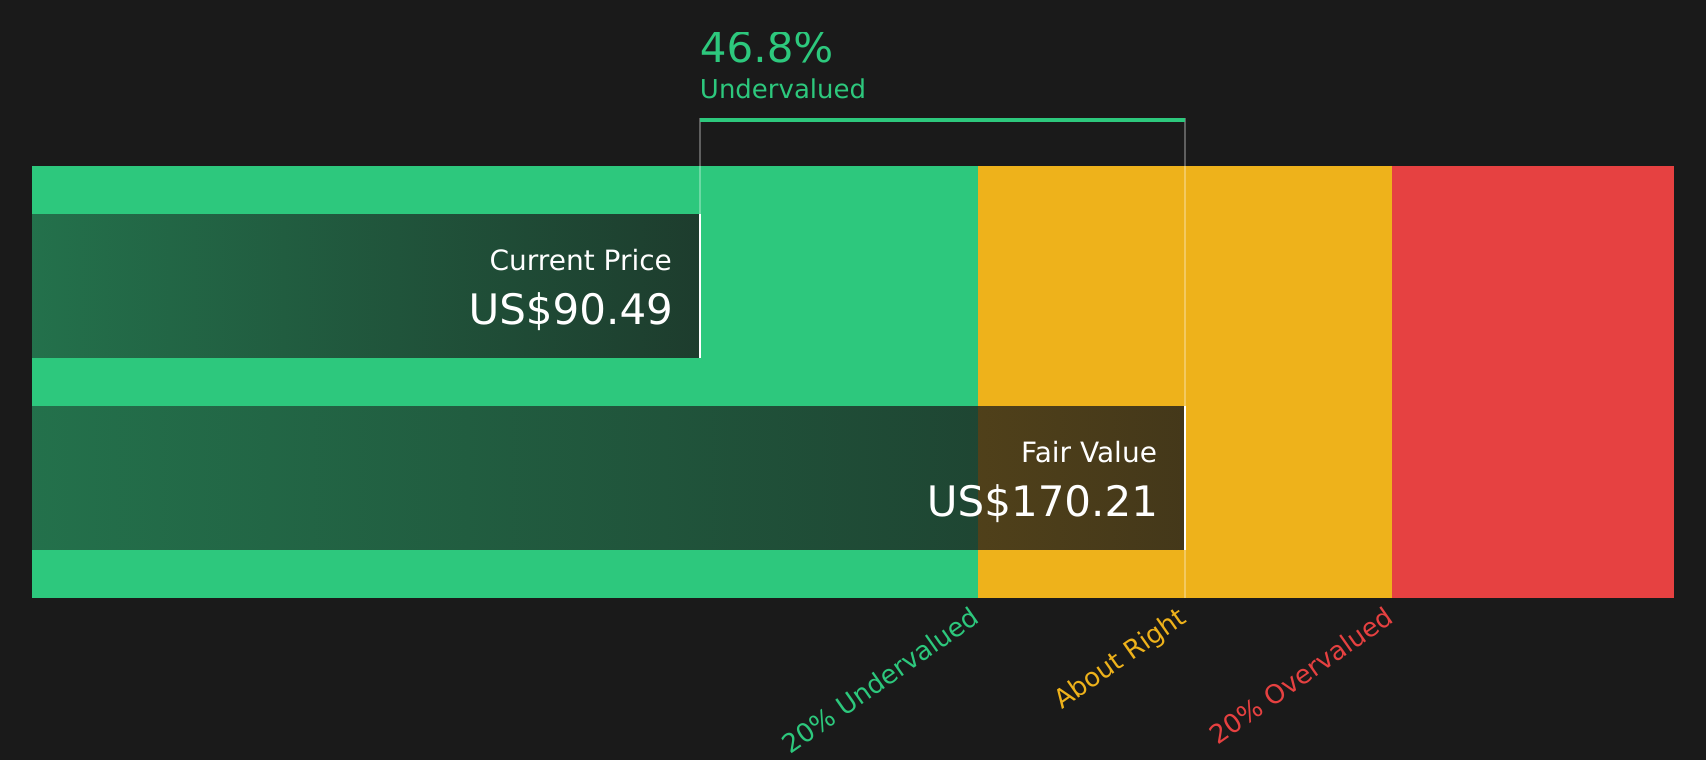
Pulling these projections together in a 2 Stage Free Cash Flow to Equity model gives an estimated intrinsic value of about $170.21 per share. Against a current share price around $90.49, that implies the stock trades at a discount of roughly 46.8%, which screens as materially undervalued under this method.
Result: UNDERVALUED
Our Discounted Cash Flow (DCF) analysis suggests Lennar is undervalued by 46.8%. Track this in your watchlist or portfolio, or discover 49 more high quality undervalued stocks.
Approach 2: Lennar Price vs Earnings
For a profitable company, the P/E ratio is a useful way to think about what you are paying for each dollar of current earnings. It ties the share price directly to actual profit, which many investors find more intuitive than cash flow or asset based models.
What counts as a "normal" P/E depends on how fast earnings are expected to grow and how risky those earnings appear. Higher expected growth and lower perceived risk can support a higher multiple, while slower growth or higher risk usually point to a lower one.
Lennar currently trades on a P/E of 12.6x. That is close to the Consumer Durables industry average of about 12.3x and below the peer group average of 14.2x. Simply Wall St also provides a Fair Ratio of 20.9x, which is the P/E it estimates could be reasonable for Lennar after factoring in elements such as earnings growth, profit margins, industry, market cap and company specific risks.
This Fair Ratio can be more informative than a simple industry or peer comparison because it adjusts for those company specific features rather than assuming one size fits all. Comparing 20.9x to the current 12.6x suggests Lennar screens as undervalued on this metric.
Result: UNDERVALUED

P/E ratios tell one story, but what if the real opportunity lies elsewhere? Start investing in legacies, not executives. Discover our 20 top founder-led companies.
Upgrade Your Decision Making: Choose your Lennar Narrative
Earlier the article mentioned that there is an even better way to think about valuation. Meet Narratives, a simple tool on Simply Wall St's Community page where you connect your view of Lennar's story with concrete forecasts for revenue, earnings, margins and a Fair Value that you can compare directly to the current share price.
A Narrative is your own joined up story. It links why you think Lennar's business might play out a certain way to a set of numbers, so instead of only seeing a P/E or DCF output, you see how assumptions about things like housing demand, incentives or an asset light model feed into a forecast and then into an estimated Fair Value.
Narratives on Simply Wall St are easy to use and update automatically when new information such as earnings releases or news is added, so your Fair Value view keeps tracking the latest inputs without you needing to rebuild a model each time.
For example, one Lennar Narrative might lean toward the cautious side with a Fair Value around US$74.0, while another more optimistic Narrative might point to about US$153.41. Seeing both side by side helps you decide where your own assumptions sit and how that compares with the current price before making any buy or sell decisions.
For Lennar, however, we will make it really easy for you with previews of two leading Lennar Narratives:
Fair value: about US$153.41 per share
Implied discount to this fair value at US$90.49: roughly 41.0%
Assumed annual revenue growth: about 7.22%
- Backs Lennar's asset light and land light model, including the Millrose spin off and Rausch Coleman Homes acquisition, as a way to improve cash flow efficiency and support earnings power.
- Assumes revenue of about US$40.1b and earnings of roughly US$3.2b by 2028, with margins easing but still supporting a future P/E of 14.1x on those earnings.
- Flags risks around housing demand, affordability, incentives running near 13%, and cost pressures that could squeeze margins if conditions stay tough for longer than analysts expect.
Fair value: about US$74.00 per share
Implied premium to this fair value at US$90.49: roughly 22.3%
Assumed annual revenue growth: about 2.76%
- Focuses on high mortgage rates, affordability constraints, and incentives around 13% as forces that could keep pressure on housing demand, gross margins and earnings.
- Works off a scenario where revenue is about US$36.0b and earnings are roughly US$1.5b by 2029, with a future P/E of 13.4x and an 18% gross margin guide seen as relatively thin cushioning.
- Accepts that the asset light approach and acquisitions could help, but argues that valuation looks full if deliveries, financial services income, and returns on capital come in below more optimistic expectations.
These two Narratives frame the current debate around Lennar's stock price in a way you can benchmark against your own assumptions about housing demand, incentives, margins and what feels like a reasonable multiple for the company over the next few years.
Do you think there's more to the story for Lennar? Head over to our Community to see what others are saying!

This article by Simply Wall St is general in nature. We provide commentary based on historical data and analyst forecasts only using an unbiased methodology and our articles are not intended to be financial advice. It does not constitute a recommendation to buy or sell any stock, and does not take account of your objectives, or your financial situation. We aim to bring you long-term focused analysis driven by fundamental data. Note that our analysis may not factor in the latest price-sensitive company announcements or qualitative material. Simply Wall St has no position in any stocks mentioned.