Is MannKind’s (MNKD) Profit Reversal Amid Rising Revenue Rewriting Its Investment Narrative?
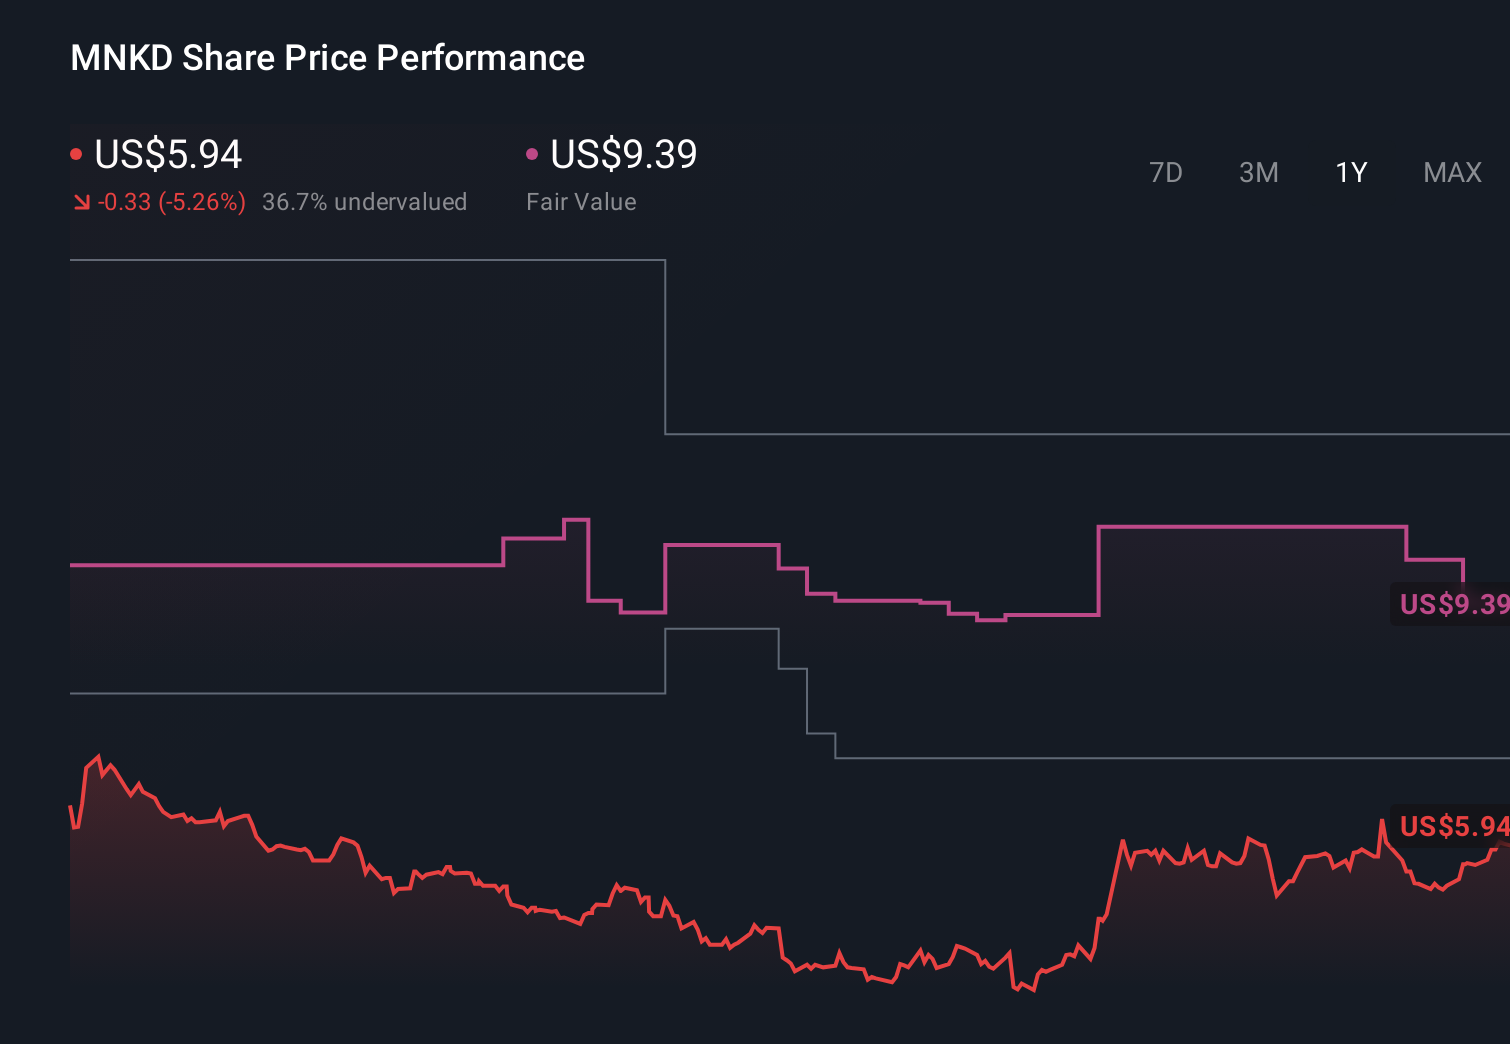
MannKind Corporation MNKD | 0.00 |
- MannKind Corporation recently reported first-quarter 2026 results, with revenue rising to US$90.17 million from US$78.35 million a year earlier, while moving from net income of US$13.16 million to a net loss of US$16.62 million.
- This shift from earnings to a loss despite higher sales highlights the importance of understanding what is driving MannKind’s changing cost and profit profile.
- We’ll now examine how the move from profit to loss despite higher revenue may influence MannKind’s broader investment narrative.
Outshine the giants: these 17 early-stage AI stocks could fund your retirement.
MannKind Investment Narrative Recap
To own MannKind today, you have to believe its Technosphere platform and Afrezza franchise can grow into a broader, profitable inhaled-therapy business, even with lumpier earnings. The latest move from profit to loss despite higher revenue keeps the near term focus squarely on cost control and margin recovery, and it makes ongoing operating losses and potential future funding needs the most immediate risk to the story. On balance, this quarter looks important but not thesis-breaking.
Among recent announcements, the upcoming FDA decision on Afrezza’s pediatric sBLA (PDUFA date May 29, 2026) looks most relevant, because it speaks directly to one of MannKind’s key catalysts: expanding Afrezza into new patient populations. How that decision lands, against the backdrop of Q1’s return to losses, may shape views on whether rising spend is effectively building future Afrezza demand or simply weighing on the income statement.
Yet while higher revenue is encouraging, the combination of fresh losses and the possibility of further financing is something investors should be aware of...
MannKind's narrative projects $544.8 million revenue and $62.0 million earnings by 2029.
Uncover how MannKind's forecasts yield a $7.17 fair value, a 102% upside to its current price.
Exploring Other Perspectives
The most bullish analysts were penciling in about US$674 million of revenue and US$120 million of earnings by 2029, which is far more optimistic than consensus and could look very different now that MannKind has shifted back into a quarterly loss.
Explore 3 other fair value estimates on MannKind - why the stock might be worth over 2x more than the current price!
The Verdict Is Yours
Don't just follow the ticker - dig into the data and build a conviction that's truly your own.
- A great starting point for your MannKind research is our analysis highlighting 3 key rewards and 2 important warning signs that could impact your investment decision.
- Our free MannKind research report provides a comprehensive fundamental analysis summarized in a single visual - the Snowflake - making it easy to evaluate MannKind's overall financial health at a glance.
Want Some Alternatives?
Markets shift fast. These stocks won't stay hidden for long. Get the list while it matters:
- The future of work is here. Discover the 32 top robotics and automation stocks leading the charge in AI-driven automation and industrial transformation.
- Capitalize on the AI infrastructure supercycle with our selection of the 39 best 'picks and shovels' of the AI gold rush converting record-breaking demand into massive cash flow.
- AI is about to change healthcare. These 35 stocks are working on everything from early diagnostics to drug discovery. The best part - they are all under $10b in market cap - there's still time to get in early.
This article by Simply Wall St is general in nature. We provide commentary based on historical data and analyst forecasts only using an unbiased methodology and our articles are not intended to be financial advice. It does not constitute a recommendation to buy or sell any stock, and does not take account of your objectives, or your financial situation. We aim to bring you long-term focused analysis driven by fundamental data. Note that our analysis may not factor in the latest price-sensitive company announcements or qualitative material. Simply Wall St has no position in any stocks mentioned.