Is Marvell Technology (MRVL) Attractive After Recent Share Price Weakness And DCF Assessment
Marvell Technology MRVL | 0.00 |
- If you are wondering whether Marvell Technology at around US$78.61 is a bargain or a value trap, this article walks through what the numbers are actually saying about the stock.
- The share price is around US$78.61, with returns of a 2.1% decline over 7 days, a 3.2% decline over 30 days, a 12.1% decline year to date, but 80.1% over 3 years and 54.6% over 5 years, which can leave investors unsure how to interpret the current setup.
- Recent news flow around Marvell has focused on its role in key semiconductor and data infrastructure markets, as investors assess how those end markets could influence sentiment on the stock. There has also been ongoing discussion of how sector wide factors and capital spending trends might be feeding into expectations for Marvell.
- On our checks, Marvell scores a 5 out of 6 valuation score, suggesting it screens as undervalued on most of the measures we look at. Next, we will break down those valuation methods before circling back to an even more rounded way to think about what the stock might be worth.
Approach 1: Marvell Technology Discounted Cash Flow (DCF) Analysis
A Discounted Cash Flow model projects a company’s future cash flows and then discounts them back to today’s value, to estimate what the business might be worth right now.
For Marvell Technology, the model used is a 2 Stage Free Cash Flow to Equity approach. The latest twelve month free cash flow is about $1.50b. Analyst based forecasts and extrapolated estimates suggest free cash flow could be around $6.38b in 2031, with intermediate projections between 2026 and 2035 ranging from roughly $1.87b to $8.46b. Simply Wall St extrapolates beyond the analyst horizon to fill out the 10 year path.
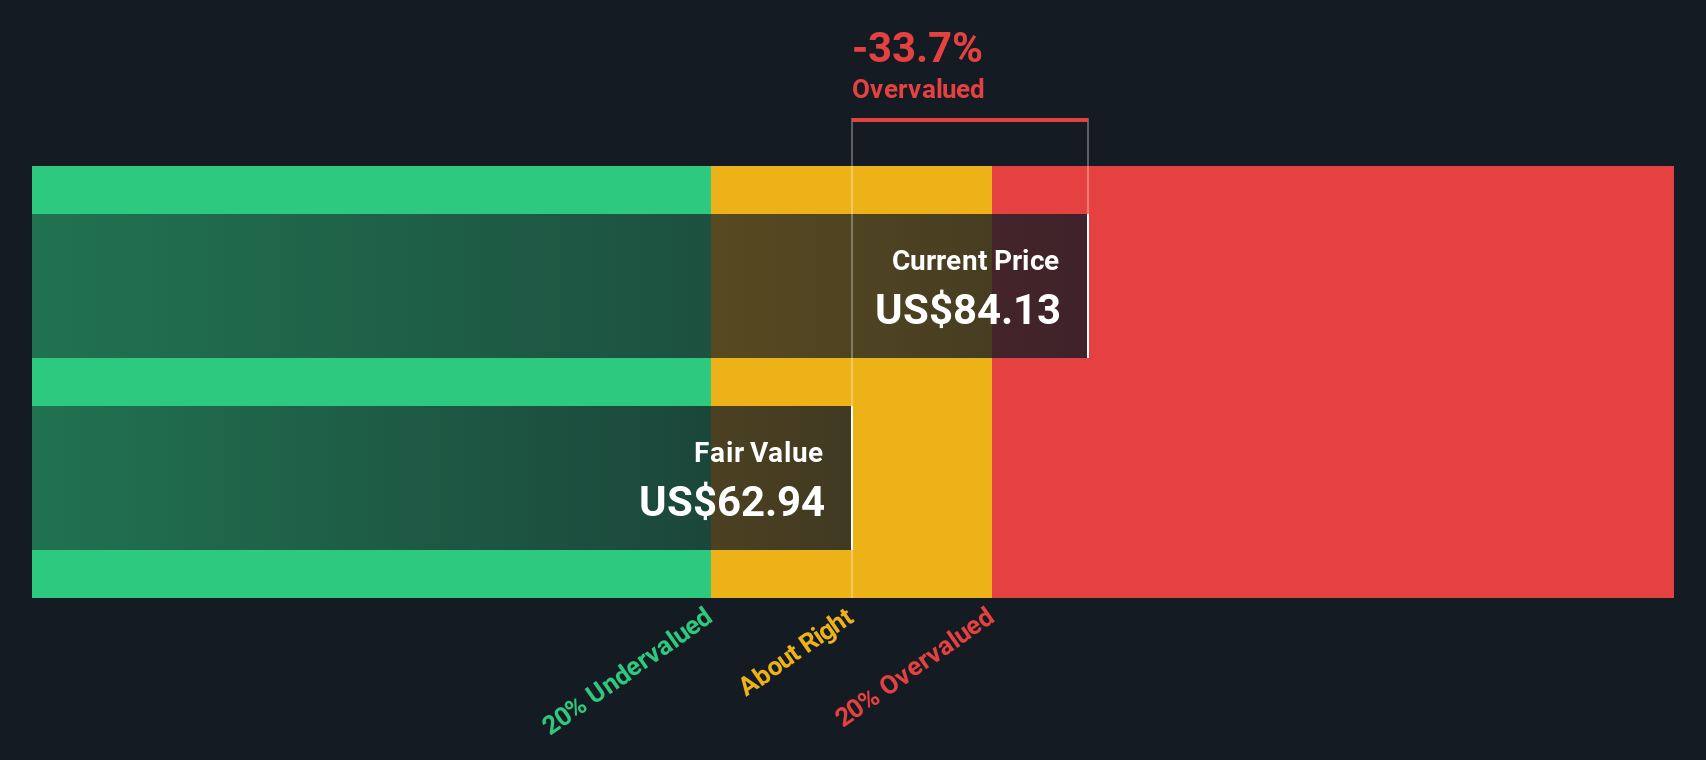
Bringing those projected cash flows back to today using a discount rate gives an estimated intrinsic value of about $83.18 per share. Against a current share price of roughly $78.61, the model points to a 5.5% implied discount, which is a small gap rather than a deep mismatch.
Result: ABOUT RIGHT
Marvell Technology is fairly valued according to our Discounted Cash Flow (DCF), but this can change at a moment's notice. Track the value in your watchlist or portfolio and be alerted on when to act.
Approach 2: Marvell Technology Price vs Earnings
For a profitable company like Marvell, the P/E ratio is a straightforward way to gauge what investors are paying for each dollar of earnings. In simple terms, higher expected growth and lower perceived risk usually support a higher P/E, while slower growth or higher risk tend to justify a lower one.
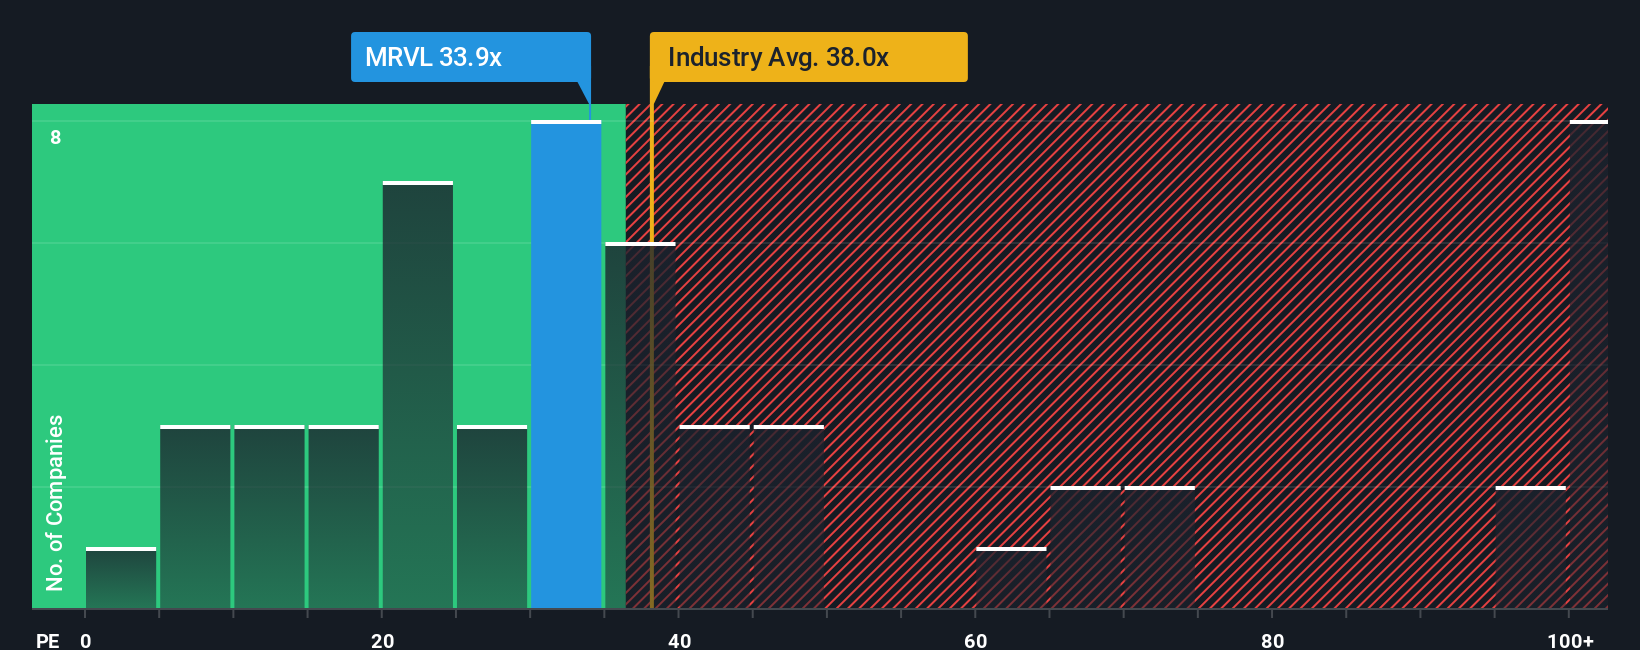
Marvell currently trades on a P/E of about 27.7x. That sits below the Semiconductor industry average of roughly 43.2x and below the peer group average of about 79.3x, which might initially make the stock look inexpensive relative to those benchmarks.
Simply Wall St also uses a “Fair Ratio” to estimate what P/E might make sense for Marvell given its earnings growth profile, industry, profit margins, market cap and risk factors. This Fair Ratio comes out at around 42.3x. Because it adjusts for company specific traits rather than just comparing with broad industry or peer averages, it can provide a more tailored reference point.
Stacking that Fair Ratio of 42.3x against the current P/E of 27.7x suggests the shares trade below what this framework would imply.
Result: UNDERVALUED
P/E ratios tell one story, but what if the real opportunity lies elsewhere? Start investing in legacies, not executives. Discover our 23 top founder-led companies.
Upgrade Your Decision Making: Choose your Marvell Technology Narrative
Earlier we mentioned that there is an even better way to understand valuation. On Simply Wall St’s Community page you can use Narratives, where you set out your story for Marvell Technology, link that story to your own revenue, earnings and margin assumptions, see the fair value that falls out of those numbers, and then compare it to the current share price. The narrative updates automatically as news or earnings arrive. For example, one investor might lean toward a higher fair value near US$148 based on stronger AI infrastructure demand and ASIC execution, while another might anchor closer to US$59 on concerns about data center concentration and cyclicality, and both can instantly see how their chosen fair value stacks up against today’s price.
Do you think there's more to the story for Marvell Technology? Head over to our Community to see what others are saying!

This article by Simply Wall St is general in nature. We provide commentary based on historical data and analyst forecasts only using an unbiased methodology and our articles are not intended to be financial advice. It does not constitute a recommendation to buy or sell any stock, and does not take account of your objectives, or your financial situation. We aim to bring you long-term focused analysis driven by fundamental data. Note that our analysis may not factor in the latest price-sensitive company announcements or qualitative material. Simply Wall St has no position in any stocks mentioned.