

Is MKS (MKSI) Undervalued As Strong Q2 Earnings Meet Margin Pressure?
MKS Inc. MKSI | 0.00 |
Why MKS stock is back in focus after Q2 earnings
MKS (MKSI) has been in the spotlight after reporting second quarter 2026 results, issuing fresh earnings guidance and affirming its dividend, with investors weighing strong growth against management’s margin caution.
The company reported second quarter revenue of US$1,248 million compared with US$973 million a year earlier. Net income was US$175 million compared with US$62 million a year earlier, and diluted earnings per share from continuing operations was US$2.41 compared with US$0.92.
For the first six months of 2026, MKS reported revenue of US$2,326 million compared with US$1,910 million a year earlier. Net income was US$258 million compared with US$114 million, with diluted earnings per share from continuing operations of US$3.60 compared with US$1.69.
MKS has seen strong momentum this year, with a year to date share price return of 90.51% and a 1 year total shareholder return of 218.95%. However, the 1 month share price return declined 1.22%, which suggests some cooling after a sharp run.
If the recent earnings move has you looking beyond a single stock, this is a good moment to scan for other semiconductor related beneficiaries tied to AI infrastructure demand using our 56 AI infrastructure stocks
MKS now trades at a clear discount to average analyst targets, even after a strong run, while management is flagging margin pressure. Is the market being cautious for good reason, or mispricing the stock’s earnings power?
Most Popular Narrative: 21.2% Undervalued
The most followed narrative currently points to a fair value for MKS of $406.92 compared with the last close of $320.74. This puts the focus squarely on what is embedded in those assumptions.
The analysts have a consensus price target of $406.92 for MKS based on their expectations of its future earnings growth, profit margins and other risk factors.
However, there is a degree of disagreement amongst analysts, with the most bullish reporting a price target of $600.0, and the most bearish reporting a price target of just $265.0.
Want to understand why this narrative supports a fair value well above today’s price? The story leans heavily on faster revenue growth, higher margins and a richer profit multiple pulled forward into the next few years.
Result: Fair Value of $406.92 (UNDERVALUED)
However, the bullish MKS narrative still hinges on a cyclical semiconductor equipment upturn and meaningful balance sheet deleveraging. Both of these could disappoint and reset expectations.
Another View on MKS using the SWS DCF model
The analyst narrative points to MKS trading below a fair value of $406.92, yet the SWS DCF model paints a different picture. On that cash flow view, the stock at $320.74 sits above an estimated value of $261.20, which implies upside is already priced in. Which lens do you trust more for your own assessment?
For a closer look at how this cash flow view is built, including the key assumptions that drive the gap to the analyst-led fair value, Look into how the SWS DCF model arrives at its fair value.
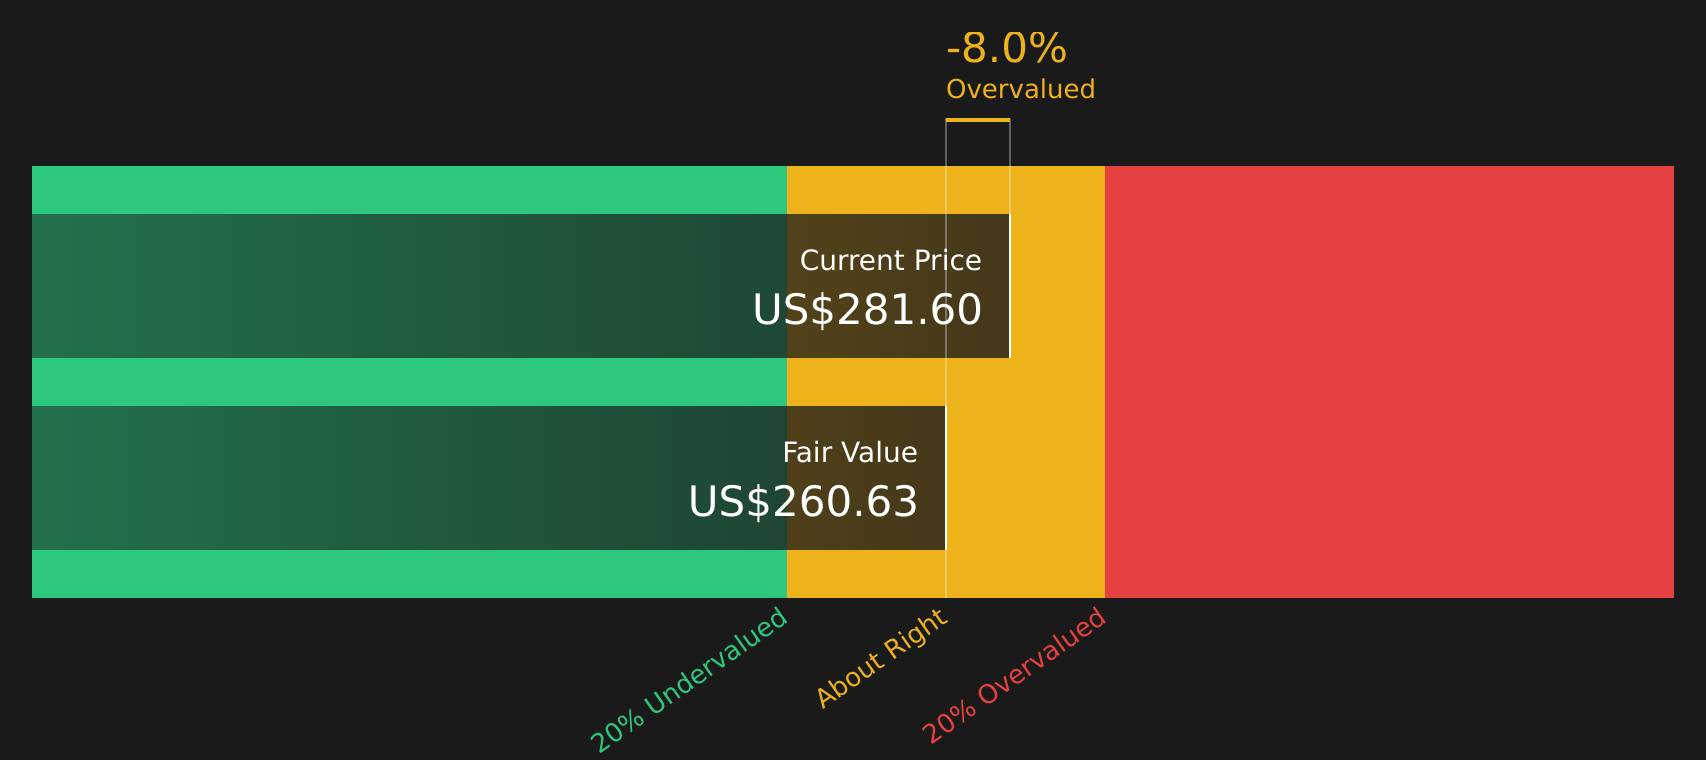
Simply Wall St performs a discounted cash flow (DCF) on every stock in the world every day (check out MKS for example). We show the entire calculation in full. You can track the result in your watchlist or portfolio and be alerted when this changes, or use our stock screener to discover 53 high quality undervalued stocks. If you save a screener we even alert you when new companies match - so you never miss a potential opportunity.
Next Steps
The mix of optimism and caution around MKS is clear right now, so this is a good time to review the evidence yourself and move quickly to form an independent view. To see both sides of the story in one place, check out the 3 key rewards and 3 important warning signs
Looking for more investment ideas beyond MKS?
If MKS has sharpened your focus on where capital works hardest, now is the moment to widen your lens and hunt for other well supported opportunities.
- Target stability first and let returns follow with a shortlist of companies filtered for resilient fundamentals using the 80 resilient stocks with low risk scores.
- Spot potential bargains early by scanning companies that combine solid quality with prices that sit below intrinsic value through the 53 high quality undervalued stocks.
- Hunt for future standouts before they hit the headlines using a focused list of under the radar companies from the screener containing 19 high quality undiscovered gems.
This article by Simply Wall St is general in nature. We provide commentary based on historical data and analyst forecasts only using an unbiased methodology and our articles are not intended to be financial advice. It does not constitute a recommendation to buy or sell any stock, and does not take account of your objectives, or your financial situation. We aim to bring you long-term focused analysis driven by fundamental data. Note that our analysis may not factor in the latest price-sensitive company announcements or qualitative material. Simply Wall St has no position in any stocks mentioned.