Is Neogen (NEOG) Pricing Make Sense After Mixed Share Performance This Year
Neogen Corp NEOG | 0.00 |
- If you are trying to figure out whether Neogen's current share price makes sense, you are not alone. A closer look at its valuation tools can help you frame that question more clearly.
- Neogen recently closed at US$9.70, with returns of a 13% decline over 7 days, a 10.2% decline over 30 days, a 38.6% gain year to date, and a 2.8% decline over the last year. This combination gives a mixed picture of how the market is currently pricing the stock.
- Recent coverage around Neogen has focused on the business itself and how investors are reassessing the company in light of its position in the healthcare sector. This context helps explain why the share price has moved both up and down over different time frames as expectations and risk perceptions have shifted.
- Neogen currently scores 5 out of 6 on Simply Wall St's valuation checks, as shown by its valuation score of 5. This sets up an interesting comparison between different valuation methods and a broader way of thinking about value that we will come back to at the end of this article.
Approach 1: Neogen Discounted Cash Flow (DCF) Analysis
A Discounted Cash Flow, or DCF, model estimates what a business could be worth today by projecting its future cash flows and discounting them back to a present value.
For Neogen, the model used is a 2 Stage Free Cash Flow to Equity approach based on cash flow projections in $. The latest twelve month free cash flow is a loss of $28.7 million. Analysts provide estimates out to 2027, with Simply Wall St extrapolating beyond that. Within these projections, free cash flow for 2026 is set at a loss of $31.1 million, then moves to $58.8 million in 2027, and the ten year projection reaches $487.7 million in 2035.
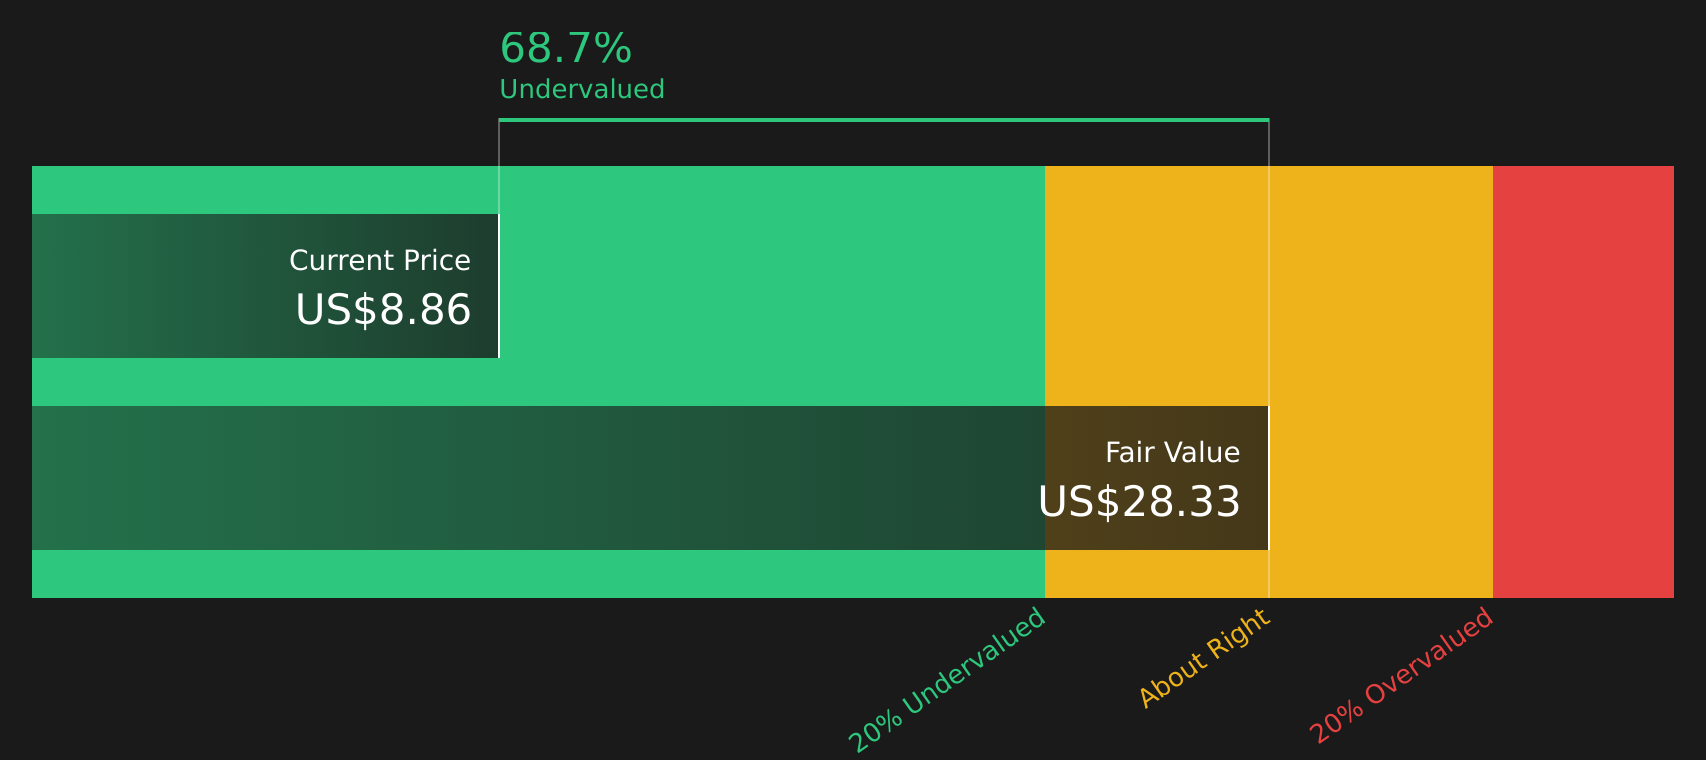
When all these projected cash flows are discounted back using the DCF model, Simply Wall St arrives at an estimated intrinsic value of about $26.31 per share. Compared with the recent share price of $9.70, this implies the stock is 63.1% undervalued according to this method.
Result: UNDERVALUED
Our Discounted Cash Flow (DCF) analysis suggests Neogen is undervalued by 63.1%. Track this in your watchlist or portfolio, or discover 46 more high quality undervalued stocks.
Approach 2: Neogen Price vs Sales
For companies where earnings are weak or uneven, price based on sales can often be a more practical yardstick than P/E. It lets you compare what investors are paying for each dollar of revenue, without getting caught up in short term profit swings.
What counts as a “normal” P/S also depends on how quickly investors think sales could grow and how much risk they see in those expectations. Higher anticipated growth or lower perceived risk can support a higher multiple, while slower growth or more uncertainty usually lines up with a lower one.
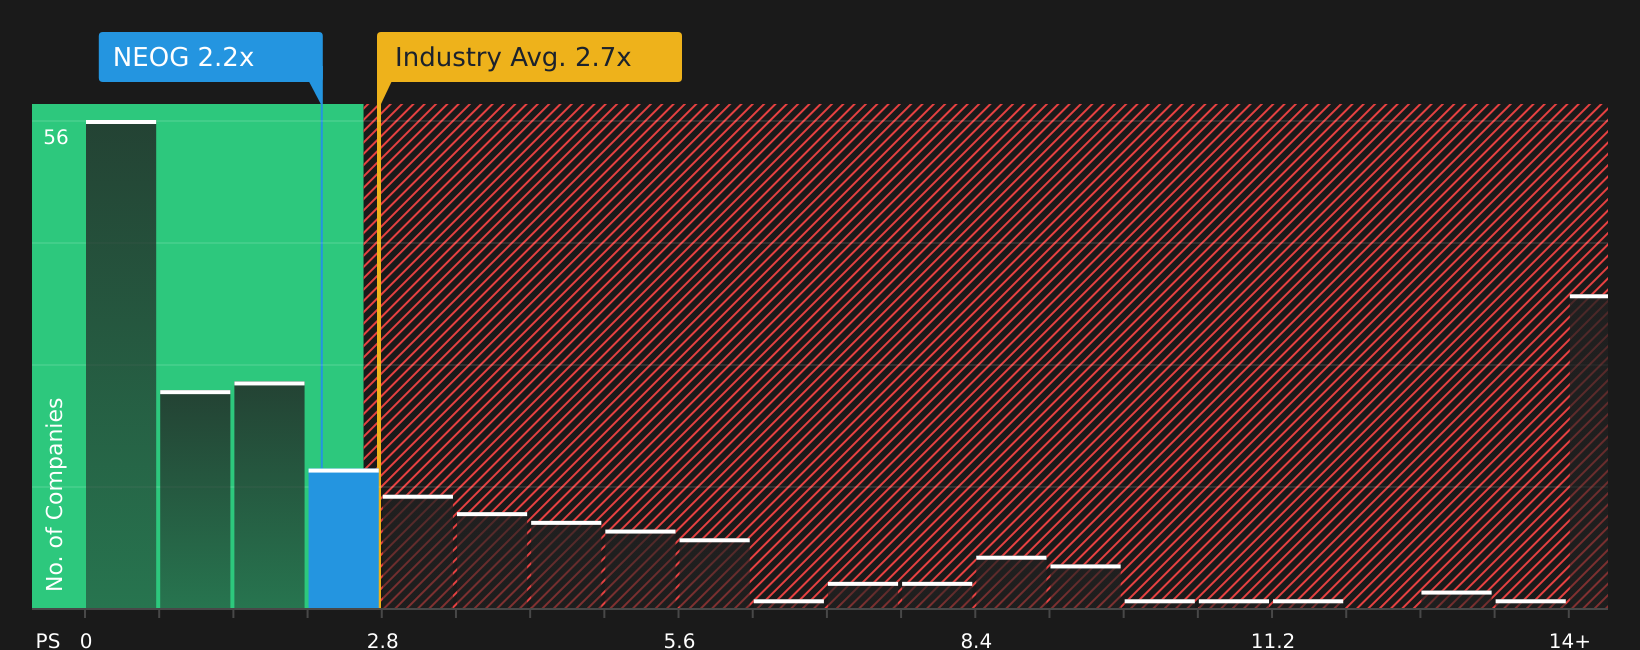
Neogen currently trades on a P/S of 2.40x. That sits below the Medical Equipment industry average of 2.90x and below the peer average of 3.51x. Simply Wall St’s proprietary Fair Ratio for Neogen is 1.19x. This Fair Ratio represents the P/S level that might be reasonable given Neogen’s own mix of earnings growth profile, industry, profit margins, market cap and specific risks. Because it is tailored to the company, it can be more informative than a simple comparison with peers or the sector, which may have very different characteristics.
Comparing Neogen’s actual P/S of 2.40x with the Fair Ratio of 1.19x suggests the shares are trading above that tailored estimate.
Result: OVERVALUED
P/S ratios tell one story, but what if the real opportunity lies elsewhere? Start investing in legacies, not executives. Discover our 20 top founder-led companies.
Upgrade Your Decision Making: Choose your Neogen Narrative
Earlier we mentioned that there is an even better way to understand valuation, so let us introduce you to Narratives, which let you put a clear story behind your numbers by tying your own view of Neogen’s future revenue, earnings and margins to a fair value estimate. A Narrative is simply your perspective written down and connected to a financial forecast. Instead of numbers sitting in isolation, you link Neogen’s business story to specific assumptions and a resulting fair value that you can compare with today’s share price. On Simply Wall St, Narratives live on the Community page and are used by millions of investors, so it is easy to see different viewpoints side by side and adjust your own as you learn more. Narratives then help you decide when you might buy or sell, because you are comparing your Fair Value to the live market Price using a framework that already reflects your risk and growth expectations. They also update automatically when new information such as earnings releases or major news appears, so you are not stuck with outdated assumptions. For Neogen, one investor might see a much higher fair value than another investor who uses more cautious forecasts, and Narratives make those differences transparent in a structured way.
Do you think there's more to the story for Neogen? Head over to our Community to see what others are saying!

This article by Simply Wall St is general in nature. We provide commentary based on historical data and analyst forecasts only using an unbiased methodology and our articles are not intended to be financial advice. It does not constitute a recommendation to buy or sell any stock, and does not take account of your objectives, or your financial situation. We aim to bring you long-term focused analysis driven by fundamental data. Note that our analysis may not factor in the latest price-sensitive company announcements or qualitative material. Simply Wall St has no position in any stocks mentioned.