Is Norfolk Southern (NSC) Pricing In Too Much Optimism After Safety Scrutiny And Strong Gains?
Norfolk Southern NSC | 0.00 |
- If you are wondering whether Norfolk Southern at US$318.20 is priced for opportunity or already reflecting high expectations, the starting point is to look closely at what the market is paying for its fundamentals.
- The stock has returned 1.9% over the last 7 days, 5.2% over 30 days, 10.6% year to date and 32.8% over 1 year, with a 58.7% return over 3 years and 27.2% over 5 years, which gives useful context before comparing price to underlying value.
- Recent headlines around Norfolk Southern have focused on ongoing scrutiny of its safety practices and regulatory environment, as well as continuing discussion of its capital investment and network efficiency plans. These themes help frame how investors think about both risk and potential future cash generation, which in turn feeds into how the stock is valued.
- On Simply Wall St's valuation framework, Norfolk Southern currently scores 2 out of 6, meaning it screens as undervalued on 2 of 6 checks. The rest of this article will walk through the main valuation methods investors often use, and will finish with a broader way to think about value that goes beyond any single model.
Norfolk Southern scores just 2/6 on our valuation checks. See what other red flags we found in the full valuation breakdown.
Approach 1: Norfolk Southern Discounted Cash Flow (DCF) Analysis
A Discounted Cash Flow model takes estimates of a company’s future cash flows and discounts them back to today’s dollars to get an implied value per share. It is essentially asking what those future cash flows are worth to you right now.
For Norfolk Southern, the latest twelve month Free Cash Flow is about $893.3m. Analysts provide explicit forecasts for several years, with Simply Wall St extending these into a longer 2 stage Free Cash Flow to Equity model. Within this framework, projected Free Cash Flow in 2030 is $2.961b, using a mix of analyst estimates through 2029 and extrapolated figures beyond that.
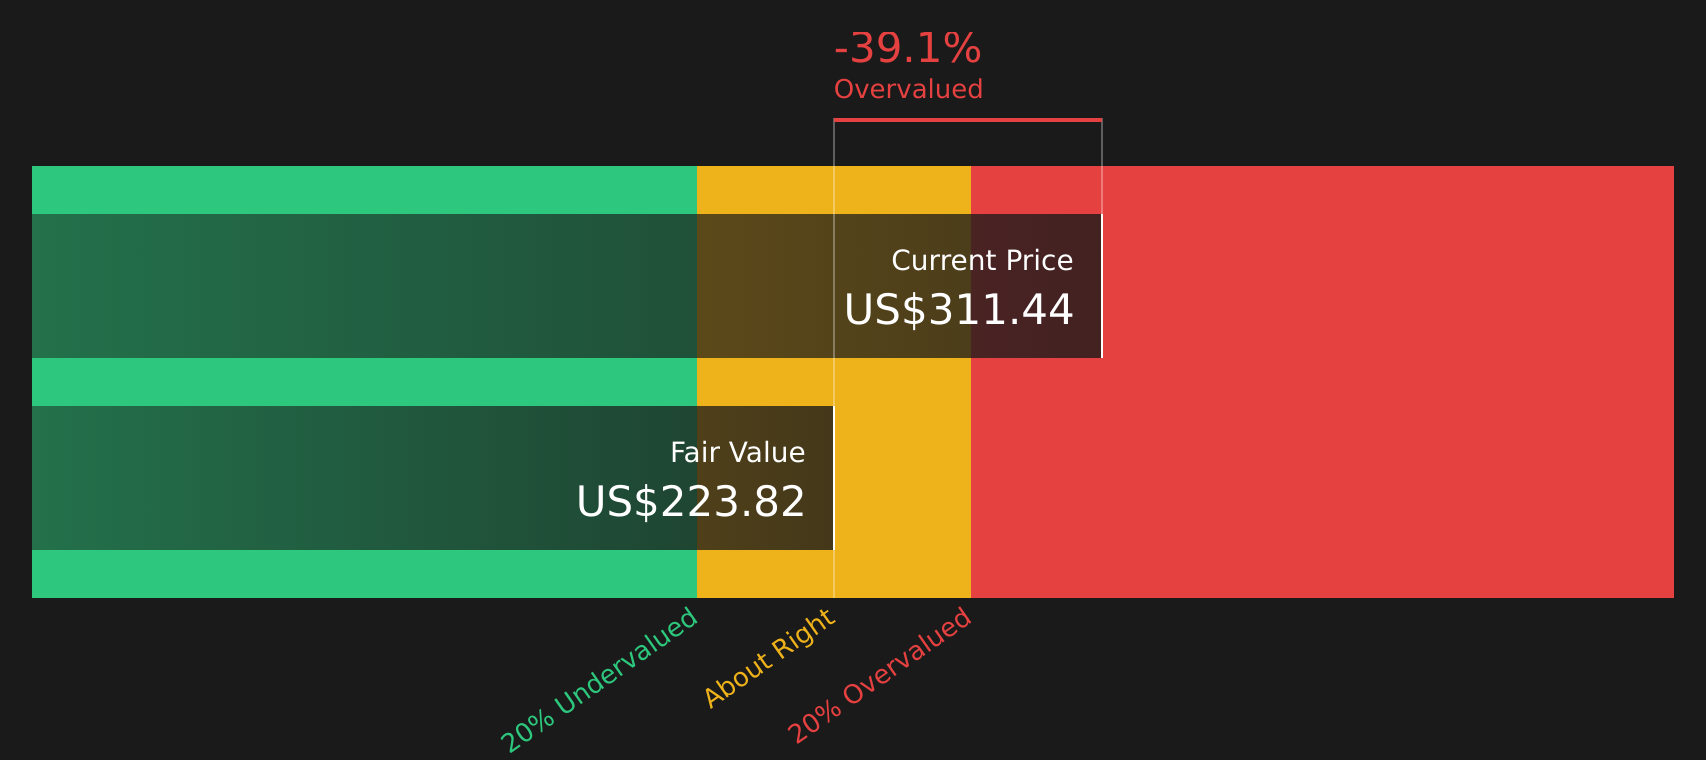
Pulling those projections together, the DCF model estimates an intrinsic value of about $224.81 per share. Compared with the current share price of $318.20, this implies the stock is about 41.5% above the DCF estimate, so on this cash flow view the shares look expensive rather than cheap.
Result: OVERVALUED
Our Discounted Cash Flow (DCF) analysis suggests Norfolk Southern may be overvalued by 41.5%. Discover 54 high quality undervalued stocks or create your own screener to find better value opportunities.
Approach 2: Norfolk Southern Price vs Earnings
For profitable companies, the P/E ratio is a straightforward way to relate what you pay for each share to the earnings that support that share. It helps you see how many years of current earnings the market is effectively paying for.
What counts as a “normal” P/E depends on how quickly earnings are expected to grow and how risky those earnings look. Higher growth and lower perceived risk can justify a higher P/E, while slower growth or higher risk usually points to a lower P/E.
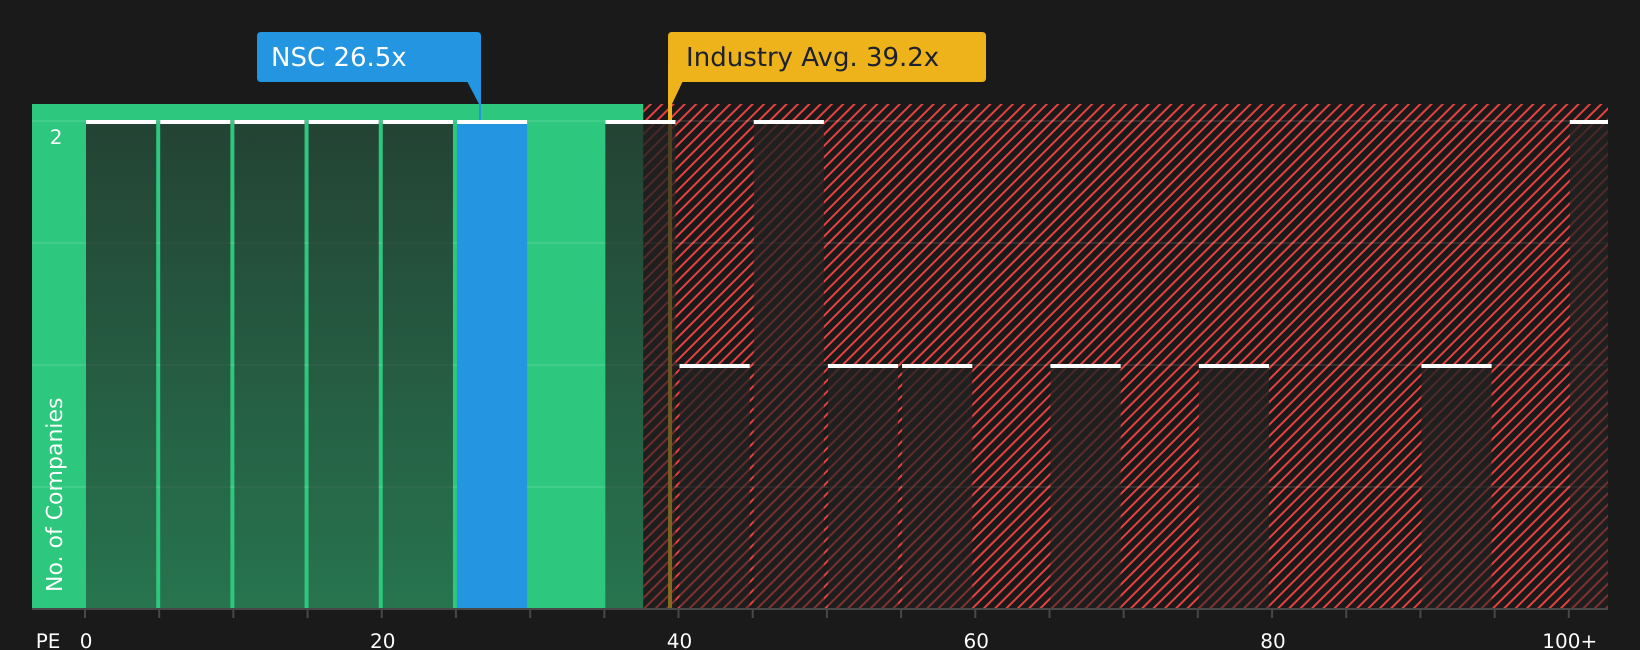
Norfolk Southern currently trades on a P/E of 26.80x, compared with a Transportation industry average of 38.89x and a peer group average of 27.08x. Simply Wall St’s Fair Ratio framework goes a step further by estimating what P/E might be reasonable given factors such as earnings growth, profit margins, industry, market cap and risk, rather than relying only on simple comparisons.
This Fair Ratio for Norfolk Southern is 23.34x, which is lower than the current 26.80x. On this preferred multiple basis, the stock looks expensive relative to what the Fair Ratio suggests.
Result: OVERVALUED
P/E ratios tell one story, but what if the real opportunity lies elsewhere? Start investing in legacies, not executives. Discover our 19 top founder-led companies.
Upgrade Your Decision Making: Choose your Norfolk Southern Narrative
Earlier it was mentioned that there is an even better way to understand valuation. Narratives are Simply Wall St’s way for you to turn your view of Norfolk Southern into a clear story that links what you think about its business, margins and growth to a financial forecast and a fair value. This is then compared with today’s price to help you decide whether the stock looks appealing or stretched. Because Narratives on the Community page are used by millions of investors and update automatically when new news or earnings arrive, you can see, for example, how a more optimistic view that supports a fair value near the bullish US$372 analyst target sits against a more cautious view closer to US$297, and then decide which story feels closer to your own expectations.
Do you think there's more to the story for Norfolk Southern? Head over to our Community to see what others are saying!

This article by Simply Wall St is general in nature. We provide commentary based on historical data and analyst forecasts only using an unbiased methodology and our articles are not intended to be financial advice. It does not constitute a recommendation to buy or sell any stock, and does not take account of your objectives, or your financial situation. We aim to bring you long-term focused analysis driven by fundamental data. Note that our analysis may not factor in the latest price-sensitive company announcements or qualitative material. Simply Wall St has no position in any stocks mentioned.