Is Norfolk Southern's Removal From the Russell 1000 Dynamic Index Reshaping the Investment Case for NSC?
Norfolk Southern Corporation NSC | 0.00 |
- Norfolk Southern Corporation was recently removed from the Russell 1000 Dynamic Index, a benchmark that influences holdings for many index-tracking investors.
- This index removal can alter demand from passive funds and active managers alike, potentially reshaping how the company fits into diversified portfolios.
- We’ll now explore how Norfolk Southern’s exit from the Russell 1000 Dynamic Index could influence its existing investment narrative and outlook.
We've uncovered the 10 dividend fortresses yielding 5%+ that don't just survive market storms, but thrive in them.
Norfolk Southern Investment Narrative Recap
To own Norfolk Southern, you need to be comfortable with a large, capital intensive railroad focused on improving efficiency and service while managing weather, coal and trade related pressures. Its removal from the Russell 1000 Dynamic Index looks more technical than fundamental, and does not materially change the near term focus on executing PSR 2.0 and controlling costs, nor does it alter key risks like exposure to storm related disruptions and the ability to defend margins as expenses evolve.
The recent opening of the East Edge intermodal corridor between Chicago and the Northeast is particularly relevant here, as it underlines Norfolk Southern's push to modernize its network and support intermodal growth. That project sits at the heart of the current catalyst around unlocking productivity and cost efficiencies, which many investors see as a key offset to pressures from coal pricing, storm costs and uncertain trade conditions.
Yet, while these operational upgrades offer upside, investors should be aware that more frequent severe weather and higher restoration costs could...
Norfolk Southern's narrative projects $14.0 billion revenue and $3.4 billion earnings by 2029. This requires 4.8% yearly revenue growth and about a $0.7 billion earnings increase from $2.7 billion today.
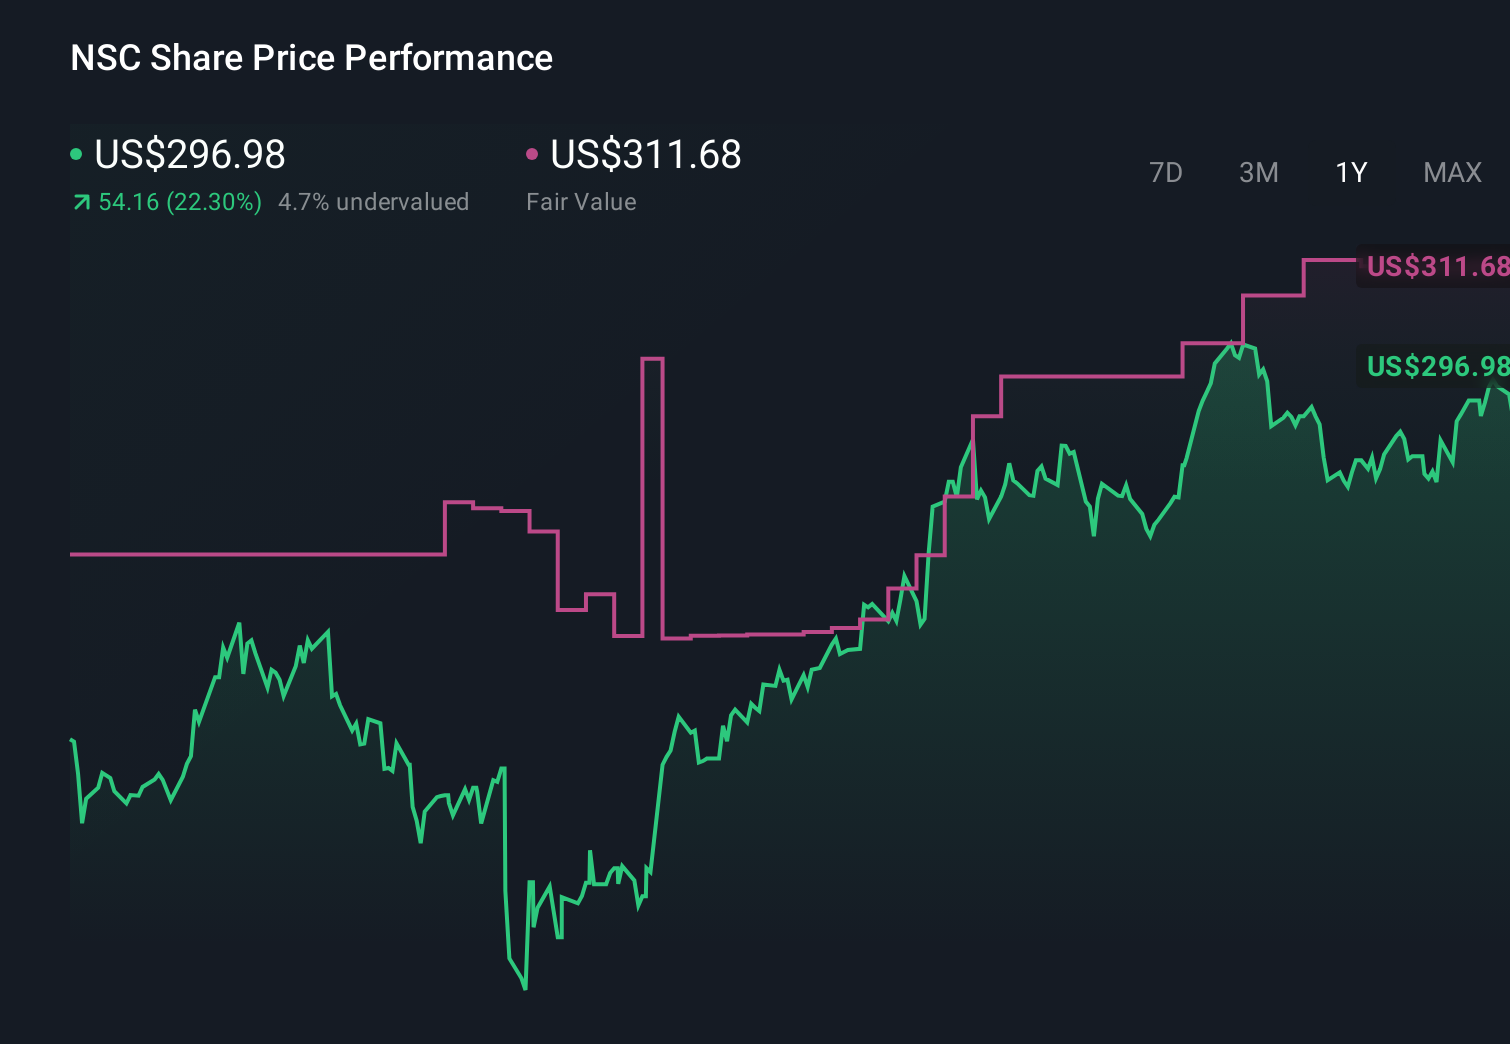
Uncover how Norfolk Southern's forecasts yield a $333.35 fair value, a 6% upside to its current price.
Exploring Other Perspectives
Two fair value estimates from the Simply Wall St Community span roughly US$224 to US$333 per share, highlighting how differently individual investors can view Norfolk Southern. Against this wide range, the company’s push for PSR 2.0 driven efficiency gains and cost control remains central to how its long term performance could unfold, so it is worth comparing several viewpoints before forming your own.
Explore 2 other fair value estimates on Norfolk Southern - why the stock might be worth 29% less than the current price!
Decide For Yourself
Don't just follow the ticker - dig into the data and build a conviction that's truly your own.
- A great starting point for your Norfolk Southern research is our analysis highlighting 3 key rewards and 1 important warning sign that could impact your investment decision.
- Our free Norfolk Southern research report provides a comprehensive fundamental analysis summarized in a single visual - the Snowflake - making it easy to evaluate Norfolk Southern's overall financial health at a glance.
Interested In Other Possibilities?
These stocks are moving-our analysis flagged them today. Act fast before the price catches up:
- AI is about to change healthcare. These 40 stocks are working on everything from early diagnostics to drug discovery. The best part - they are all under $10b in market cap - there's still time to get in early.
- Uncover the next big thing with 22 elite penny stocks that balance risk and reward.
- Capitalize on the AI infrastructure supercycle with our selection of the 51 best 'picks and shovels' of the AI gold rush converting record-breaking demand into massive cash flow.
This article by Simply Wall St is general in nature. We provide commentary based on historical data and analyst forecasts only using an unbiased methodology and our articles are not intended to be financial advice. It does not constitute a recommendation to buy or sell any stock, and does not take account of your objectives, or your financial situation. We aim to bring you long-term focused analysis driven by fundamental data. Note that our analysis may not factor in the latest price-sensitive company announcements or qualitative material. Simply Wall St has no position in any stocks mentioned.