Is Northrop Grumman (NOC) Priced Too Rich After Strong Multi Year Share Gains?
Northrop Grumman Corp. NOC | 702.50 | +0.79% |
- If you are wondering whether Northrop Grumman's share price still makes sense at current levels, this article walks through what that price could imply about value.
- The stock last closed at US$753.84, with returns of 7.1% over 7 days, 10.0% over 30 days, 28.7% year to date, 61.5% over 1 year, 70.3% over 3 years and 172.4% over 5 years.
- Recent headlines around Northrop Grumman have centered on its role as a major U.S. defense contractor and a key player in large government programs. This often shapes how investors think about its long term contract visibility and cash flows. This kind of news tends to frame expectations around the stability and potential growth of future revenue streams, which can help explain why the share price has been in focus.
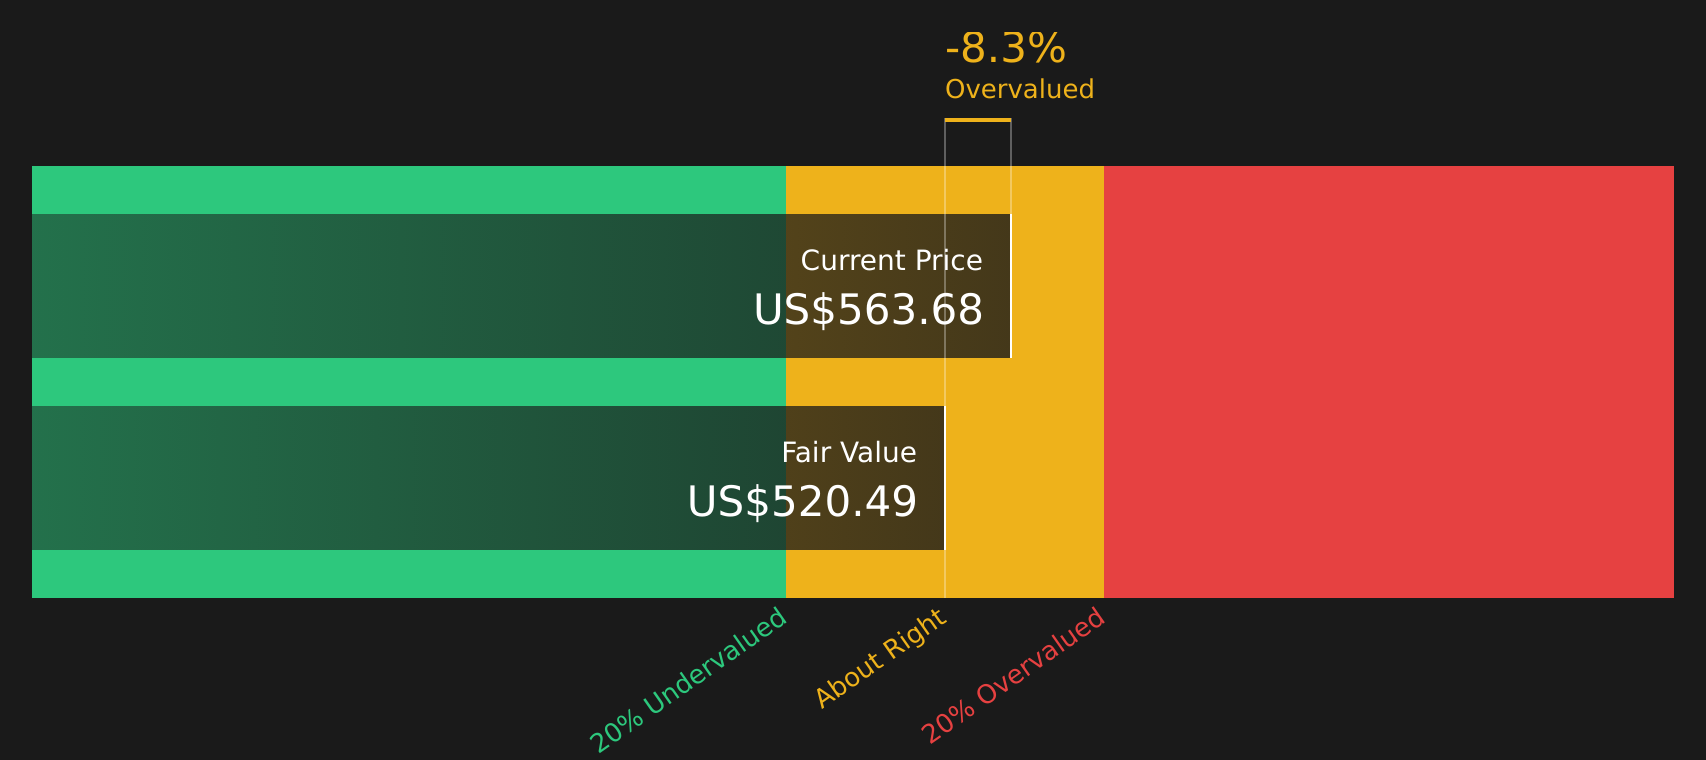
- On Simply Wall St's valuation checks, Northrop Grumman currently scores 3 out of 6 for potential undervaluation. Next we will look at what traditional valuation tools say about that number, before finishing with a broader way to think about what the stock might be worth.
Approach 1: Northrop Grumman Discounted Cash Flow (DCF) Analysis
A Discounted Cash Flow, or DCF, model takes estimates of the cash a company could generate in the future and discounts those back to today, aiming to translate long term cash flows into a single present value per share.
For Northrop Grumman, Simply Wall St uses a 2 Stage Free Cash Flow to Equity model based on cash flows reported and projected in US$. The latest twelve month free cash flow is about $3.0b. Analysts have supplied forecasts for the next few years and Simply Wall St then extrapolates beyond that, with one illustration being a projected free cash flow of $4.0b in 2030. Discounting the full set of projected cash flows produces an estimated intrinsic value of about $512.86 per share.
Against the recent share price of $753.84, this DCF output suggests Northrop Grumman trades at around a 47.0% premium to the model’s estimate of fair value, which screens as expensive on this framework.
Result: OVERVALUED
Our Discounted Cash Flow (DCF) analysis suggests Northrop Grumman may be overvalued by 47.0%. Discover 47 high quality undervalued stocks or create your own screener to find better value opportunities.
Approach 2: Northrop Grumman Price vs Earnings
For profitable companies like Northrop Grumman, the P/E ratio is a common way to think about value because it links what you are paying per share directly to the earnings the business is producing today. Investors usually accept a higher P/E when they expect stronger earnings growth or see lower risk. In contrast, slower growth or higher uncertainty tends to justify a lower, more cautious multiple.
Northrop Grumman currently trades on a P/E of 25.6x. That is below the Aerospace & Defense industry average of about 45.9x and also below the peer group average of 41.5x. Simply Wall St also calculates a “Fair Ratio” for the company of 35.4x, which is an internally derived P/E that reflects factors such as earnings growth, profit margins, industry, market cap and specific risk profile.
Compared with basic industry or peer comparisons, this Fair Ratio is designed to be more tailored to the company’s own fundamentals rather than assuming it should trade in line with the rest of the sector. Since Northrop Grumman’s actual P/E of 25.6x is meaningfully below the Fair Ratio of 35.4x, the shares screen as trading below that proprietary estimate of fair value.
Result: UNDERVALUED

P/E ratios tell one story, but what if the real opportunity lies elsewhere? Start investing in legacies, not executives. Discover our 20 top founder-led companies.
Upgrade Your Decision Making: Choose your Northrop Grumman Narrative
Earlier we mentioned that there is an even better way to understand valuation. On Simply Wall St’s Community page you can use Narratives, where you sketch out your story for Northrop Grumman, plug in your assumptions for future revenue, earnings and margins, and link that story to a financial forecast and a fair value. You can then compare that fair value directly with the current share price to help decide if and when you might buy or sell. The model automatically updates as fresh news or earnings arrive. For example, one investor could build a higher conviction Narrative around the US$690.0 analyst target, while another leans on the more cautious US$510.0 view, both using the same tool but reflecting very different perspectives on the same company.
Do you think there's more to the story for Northrop Grumman? Head over to our Community to see what others are saying!

This article by Simply Wall St is general in nature. We provide commentary based on historical data and analyst forecasts only using an unbiased methodology and our articles are not intended to be financial advice. It does not constitute a recommendation to buy or sell any stock, and does not take account of your objectives, or your financial situation. We aim to bring you long-term focused analysis driven by fundamental data. Note that our analysis may not factor in the latest price-sensitive company announcements or qualitative material. Simply Wall St has no position in any stocks mentioned.