Is Northrop Grumman (NOC) Pricing In Too Much Future Growth After Recent Share Gains?
Northrop Grumman NOC | 0.00 |
- Wondering if Northrop Grumman at around US$563.68 is offering fair value, or if the current price is out of line with what you get for owning the stock?
- The stock is up 1.5% over the past week, slightly down 0.8% over the last 30 days, and shows returns of 18.1% over 1 year, 32.9% over 3 years, and 61.2% over 5 years. This raises questions about how much of this is already reflected in the current price.
- Recent coverage has focused on Northrop Grumman's role as a large US defense contractor. Investors are watching how long-term programs and contract exposure shape expectations for future cash flows and capital returns. This backdrop helps explain why sentiment can shift even on modest price moves, as the market reassesses what it is willing to pay for these characteristics.
- On Simply Wall St's valuation checks, Northrop Grumman scores a 4 out of 6 valuation score. The rest of this article will walk through standard valuation approaches before finishing with a broader way to think about what that score really means for you.
Approach 1: Northrop Grumman Discounted Cash Flow (DCF) Analysis
A Discounted Cash Flow, or DCF, model estimates what a stock could be worth today by projecting its future cash flows and discounting them back to a present value using a required rate of return.
For Northrop Grumman, the model uses a 2 Stage Free Cash Flow to Equity approach. The latest twelve month free cash flow is about $2.99b. Analyst based projections and extrapolations out to 2035 suggest free cash flow figures in the range of roughly $3.33b in 2026 and $4.98b in 2035, with a specific projection of $4.29b for 2030. Simply Wall St uses analyst estimates for the nearer years and then extends the trend further out.
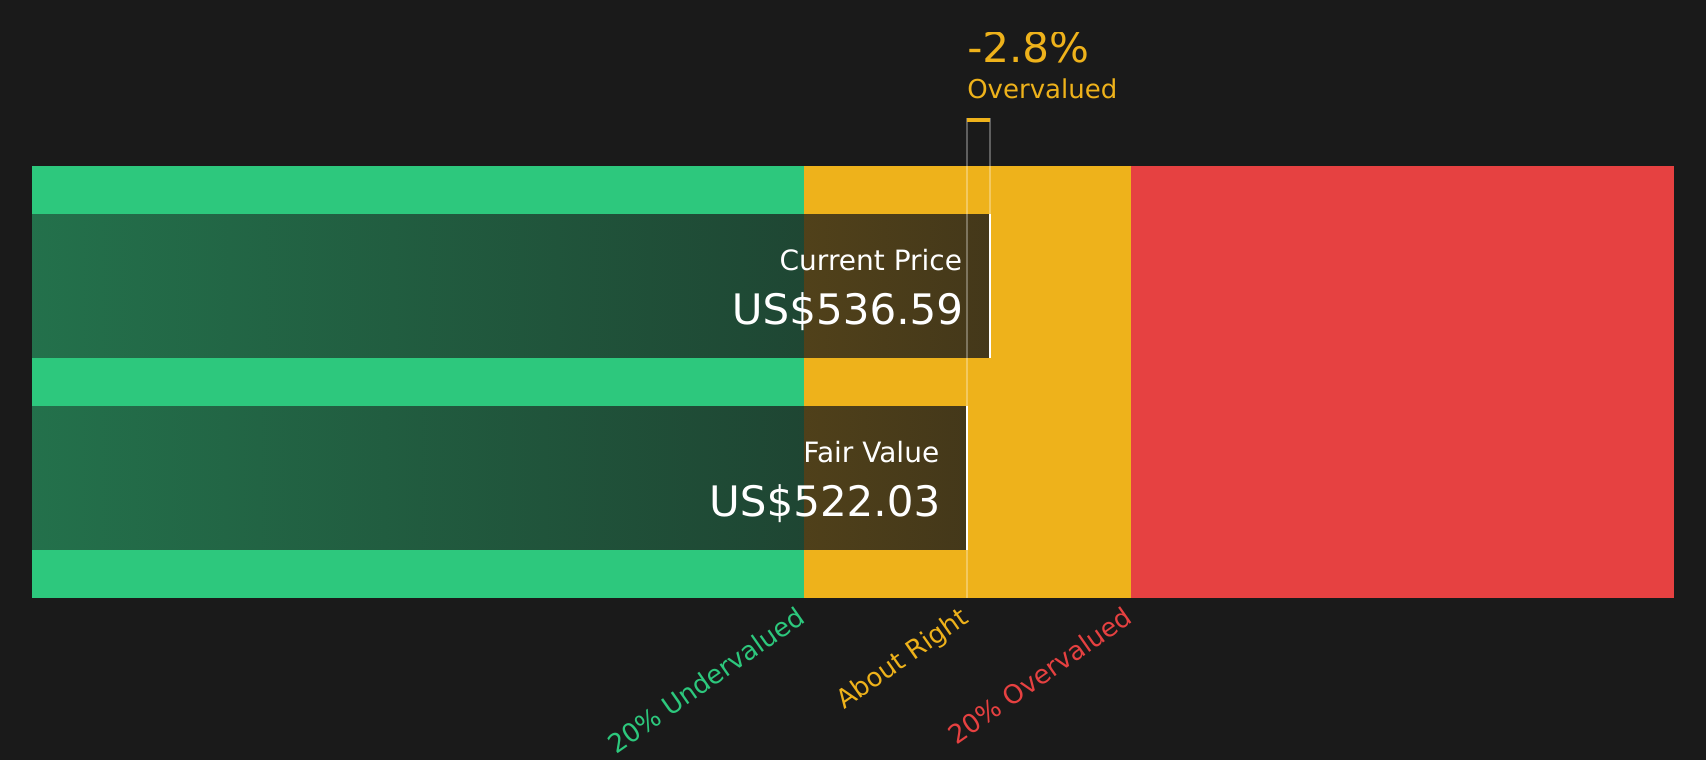
When those projected cash flows are discounted back to today and divided by the number of shares, the model arrives at an estimated intrinsic value of about $521.51 per share. Compared with a current share price around $563.68, this implies the stock is about 8.1% above the DCF estimate, so only modestly rich on this measure.
Result: ABOUT RIGHT
Northrop Grumman is fairly valued according to our Discounted Cash Flow (DCF), but this can change at a moment's notice. Track the value in your watchlist or portfolio and be alerted on when to act.
Approach 2: Northrop Grumman Price vs Earnings
For profitable companies, the P/E ratio is a useful way to relate what you pay for the stock to the earnings the company is already generating. It gives you a quick sense of how many dollars investors are willing to pay for each dollar of current earnings.
What counts as a "normal" P/E depends on what investors expect for future growth and how risky those earnings look. Higher expected growth or lower perceived risk often support a higher P/E, while slower growth or higher risk usually point to a lower P/E.
Northrop Grumman is trading on a P/E of about 17.50x. That sits well below the Aerospace & Defense industry average of about 40.22x, and also below the peer average of roughly 29.69x. Simply Wall St’s proprietary Fair Ratio for Northrop Grumman is 28.20x. This Fair Ratio is designed to be more tailored than simple peer or industry comparisons because it incorporates factors such as earnings growth, risks, profit margins, industry context and market cap into a single reference point.
Comparing the current P/E of 17.50x with the Fair Ratio of 28.20x suggests the stock is trading at a discount to what that framework would indicate.
Result: UNDERVALUED

P/E ratios tell one story, but what if the real opportunity lies elsewhere? Start investing in legacies, not executives. Discover our 20 top founder-led companies.
Upgrade Your Decision Making: Choose your Northrop Grumman Narrative
Earlier it was mentioned that there is an even better way to understand valuation. Narratives on Simply Wall St give you a simple story behind your numbers by linking your view of Northrop Grumman, such as whether programs like B 21, Sentinel and space or AI projects support higher or lower future revenue, margins and P/E multiples, to a financial forecast and a fair value that you can compare with the current share price. All of this is available within the Community page where millions of investors share views. These Narratives then update automatically when new earnings, news or analyst targets arrive. One investor might build a more confident Narrative that lines up with a fair value closer to US$815.0, while another might focus more on contract or budget risks and anchor on a fair value nearer US$603.0. This provides a clear range of perspectives to weigh against your own expectations.
Do you think there's more to the story for Northrop Grumman? Head over to our Community to see what others are saying!

This article by Simply Wall St is general in nature. We provide commentary based on historical data and analyst forecasts only using an unbiased methodology and our articles are not intended to be financial advice. It does not constitute a recommendation to buy or sell any stock, and does not take account of your objectives, or your financial situation. We aim to bring you long-term focused analysis driven by fundamental data. Note that our analysis may not factor in the latest price-sensitive company announcements or qualitative material. Simply Wall St has no position in any stocks mentioned.