Is Okta (OKTA) Pricing Look Misaligned After Multi Year Share Price Weakness
Okta, Inc. Class A OKTA | 80.19 | +1.32% |
- If you are wondering whether Okta's current share price lines up with its underlying worth, you are not alone. This article is aimed squarely at unpacking that question.
- Okta's share price closed at US$83.42, with returns of an 8.1% decline over the last 7 days, a 4.9% decline over 30 days, a 0.3% decline year to date, a 14.4% decline over 1 year, a 9.9% decline over 3 years, and a 70.9% decline over 5 years. These movements raise questions about how the market is currently weighing growth potential against risk.
- Recently, Okta has been in the spotlight as investors reassess how identity and access management fits into their broader software exposure. That broader attention provides useful context when you look at how the share price has moved over different time frames.
- On our checks, Okta scores 2 out of 6 on valuation, as shown in this valuation score. Next we will look at how different methods assess its price, before finishing with a way of thinking about valuation that can help tie all these pieces together.
Okta scores just 2/6 on our valuation checks. See what other red flags we found in the full valuation breakdown.
Approach 1: Okta Discounted Cash Flow (DCF) Analysis
A Discounted Cash Flow, or DCF, model looks at the cash Okta is expected to generate in the future, then discounts those projected cash flows back to today to estimate what the business might be worth right now.
Okta's latest twelve month Free Cash Flow is about $888.3 million. Analysts have provided annual Free Cash Flow estimates out to 2031, with Simply Wall St extrapolating beyond the initial analyst horizon to build a 2 Stage Free Cash Flow to Equity model. Within this framework, projected Free Cash Flow for 2031 is $1.48b, and the model also includes a further set of discounted projections through 2035 based on estimated growth rates.
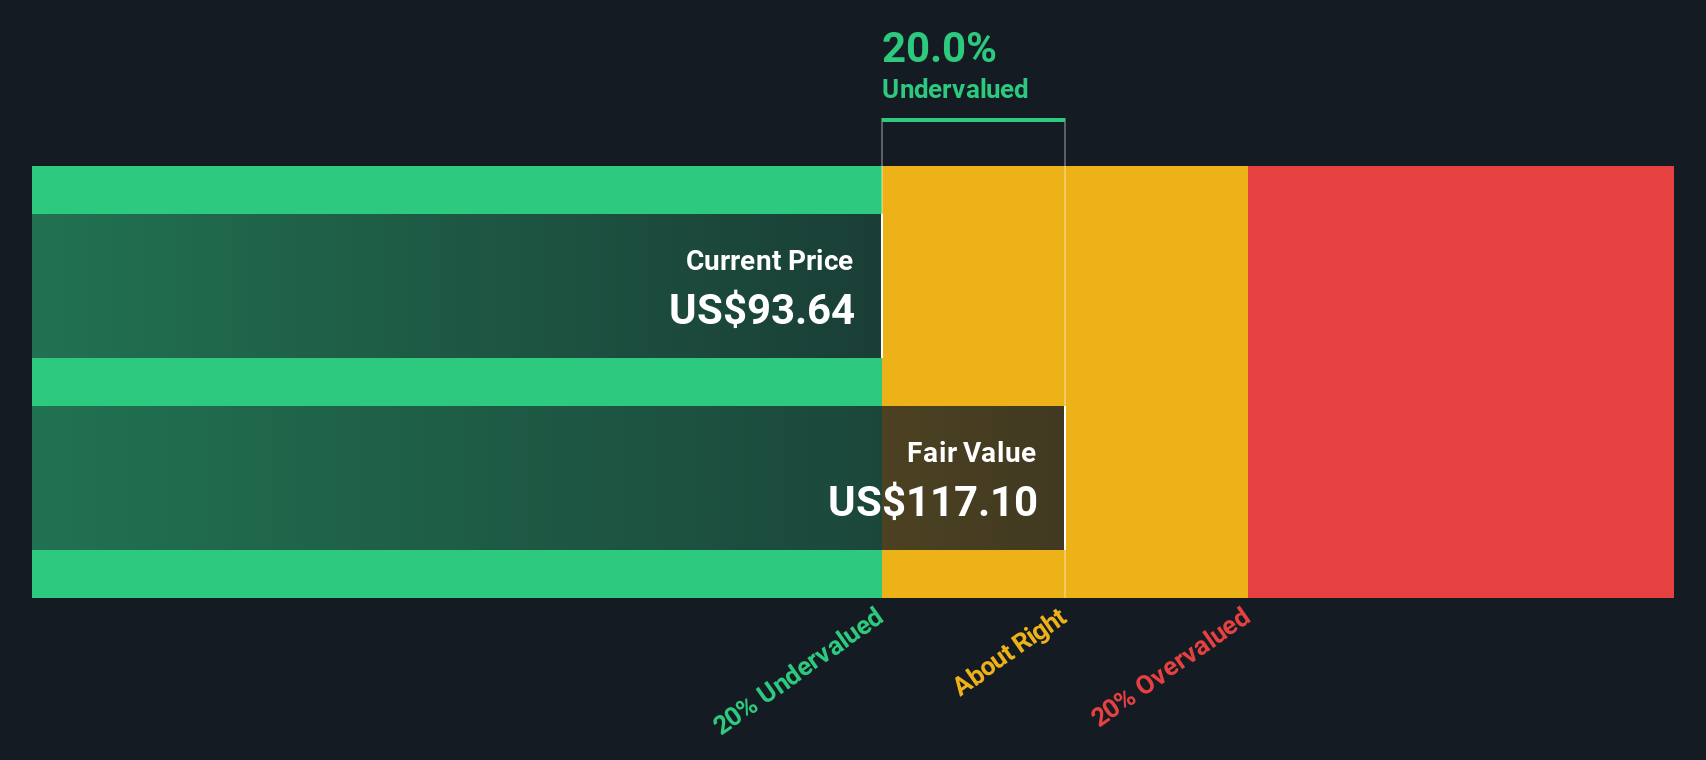
Pulling those cash flows together, the DCF model arrives at an estimated intrinsic value of $133.67 per share. Compared with the recent share price of $83.42, this output suggests Okta is trading at a 37.6% discount to that intrinsic value. On this measure, the stock appears to be undervalued.
Result: UNDERVALUED
Our Discounted Cash Flow (DCF) analysis suggests Okta is undervalued by 37.6%. Track this in your watchlist or portfolio, or discover 868 more undervalued stocks based on cash flows.
Approach 2: Okta Price vs Earnings
For profitable companies, the P/E ratio is a useful way to link what you pay for each share to the earnings that support it. It gives you a quick sense of how many dollars of price the market is attaching to each dollar of profit.
What counts as a “normal” P/E depends a lot on two things: how fast earnings are expected to grow and how risky those earnings look. Higher growth and lower perceived risk tend to support a higher P/E, while slower growth or higher risk usually mean a lower one.
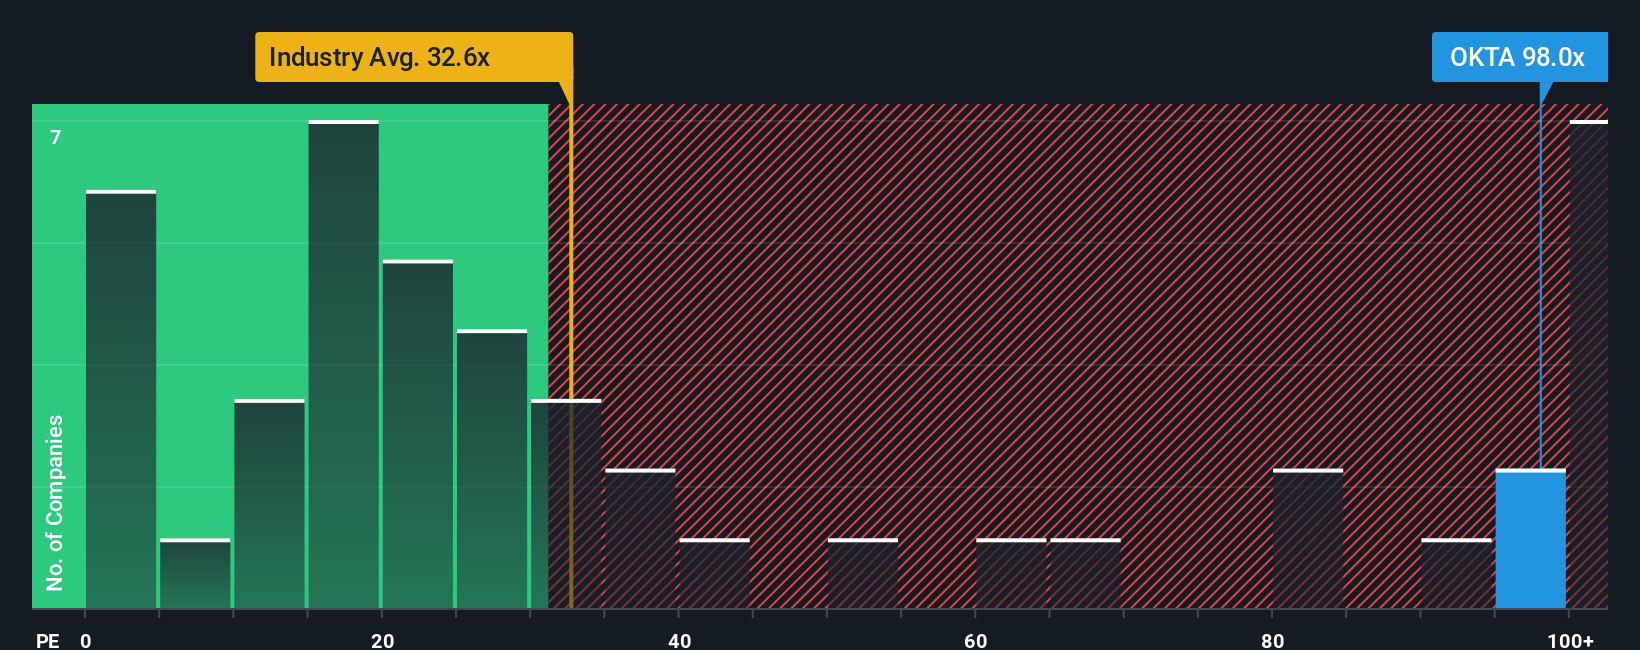
Okta is currently trading on a P/E of 75.82x. That is above the IT industry average of 26.09x and also above the peer group average of 29.62x. Simply Wall St’s Fair Ratio for Okta is 34.81x, which is its proprietary estimate of what a more suitable P/E might be after factoring in earnings growth, industry, profit margins, market cap and company specific risks.
The Fair Ratio aims to improve on simple peer or industry comparisons by tailoring the multiple to Okta’s own profile instead of assuming that all IT stocks deserve similar pricing. Compared with the current 75.82x P/E, the 34.81x Fair Ratio implies the shares are trading at a richer level than this framework would suggest.
Result: OVERVALUED
P/E ratios tell one story, but what if the real opportunity lies elsewhere? Discover 1426 companies where insiders are betting big on explosive growth.
Upgrade Your Decision Making: Choose your Okta Narrative
Earlier we mentioned that there is an even better way to understand valuation, so let us introduce you to Narratives, which are Simply Wall St's way of connecting your view of a company with the numbers behind it.
A Narrative is your story about Okta, written in financial terms, where you link what you believe about its business to assumptions for future revenue, earnings and margins, then to a fair value that makes sense to you.
On Simply Wall St's Community page, used by millions of investors, you can build or follow Narratives that turn this story into a full forecast and fair value. You can then compare that fair value with the current share price to help you decide whether the stock looks attractive or not.
Because Narratives update automatically when new information such as news or earnings is added to the platform, your fair value view can keep up with what is happening without you rebuilding everything from scratch. One Okta Narrative might point to a higher fair value based on optimistic growth and margins, while another assumes more conservative figures and arrives at a much lower fair value. This shows how two investors can look at the same stock and reach very different conclusions.
Do you think there's more to the story for Okta? Head over to our Community to see what others are saying!

This article by Simply Wall St is general in nature. We provide commentary based on historical data and analyst forecasts only using an unbiased methodology and our articles are not intended to be financial advice. It does not constitute a recommendation to buy or sell any stock, and does not take account of your objectives, or your financial situation. We aim to bring you long-term focused analysis driven by fundamental data. Note that our analysis may not factor in the latest price-sensitive company announcements or qualitative material. Simply Wall St has no position in any stocks mentioned.