Is ONEOK (OKE) Pricing Reflecting Its Midstream Role And Recent Share Performance?
ONEOK, Inc. OKE | 85.21 85.21 | +1.32% 0.00% Post |
- If you are wondering whether ONEOK’s current share price fairly reflects its underlying value, you are not alone. This article is built to help you connect the recent price action with the fundamentals.
- ONEOK closed at US$86.11, with returns of 3.2% over the past week, 15.7% over the last 30 days, 15.8% year to date and a 7.8% decline over the past year, alongside longer term returns of 52.4% over 3 years and 150.4% over 5 years.
- Recent news coverage around ONEOK has focused on its role as a large U.S. midstream energy company, including commentary on how its asset footprint and exposure to natural gas liquids position it within the broader energy sector. These themes help frame how investors may be thinking about the balance between income potential, capital needs and long term demand for its infrastructure, which can all feed into how the market prices the stock.
- Simply Wall St currently gives ONEOK a valuation score of 4 out of 6, which suggests there are several checks where the shares appear undervalued. Next we will walk through the key valuation approaches and then wrap up with a more complete way to think about value that pulls everything together.
Approach 1: ONEOK Discounted Cash Flow (DCF) Analysis
A Discounted Cash Flow model takes estimates of a company’s future cash flows and discounts them back to today’s value, so you can compare that estimate of intrinsic value to the current share price.
For ONEOK, the model uses a 2 Stage Free Cash Flow to Equity approach. The latest twelve month free cash flow is about US$2.87b. Analysts have provided explicit free cash flow estimates for several years, and Simply Wall St then extends those projections out to 2035 using its own assumptions.
The ten year path in the model sees projected free cash flow reach US$5.12b in 2030, with interim years such as 2026 to 2029 sitting between roughly US$3.64b and US$4.83b based on the data and extrapolations provided. All of these future cash flows are discounted back to today using the DCF framework.
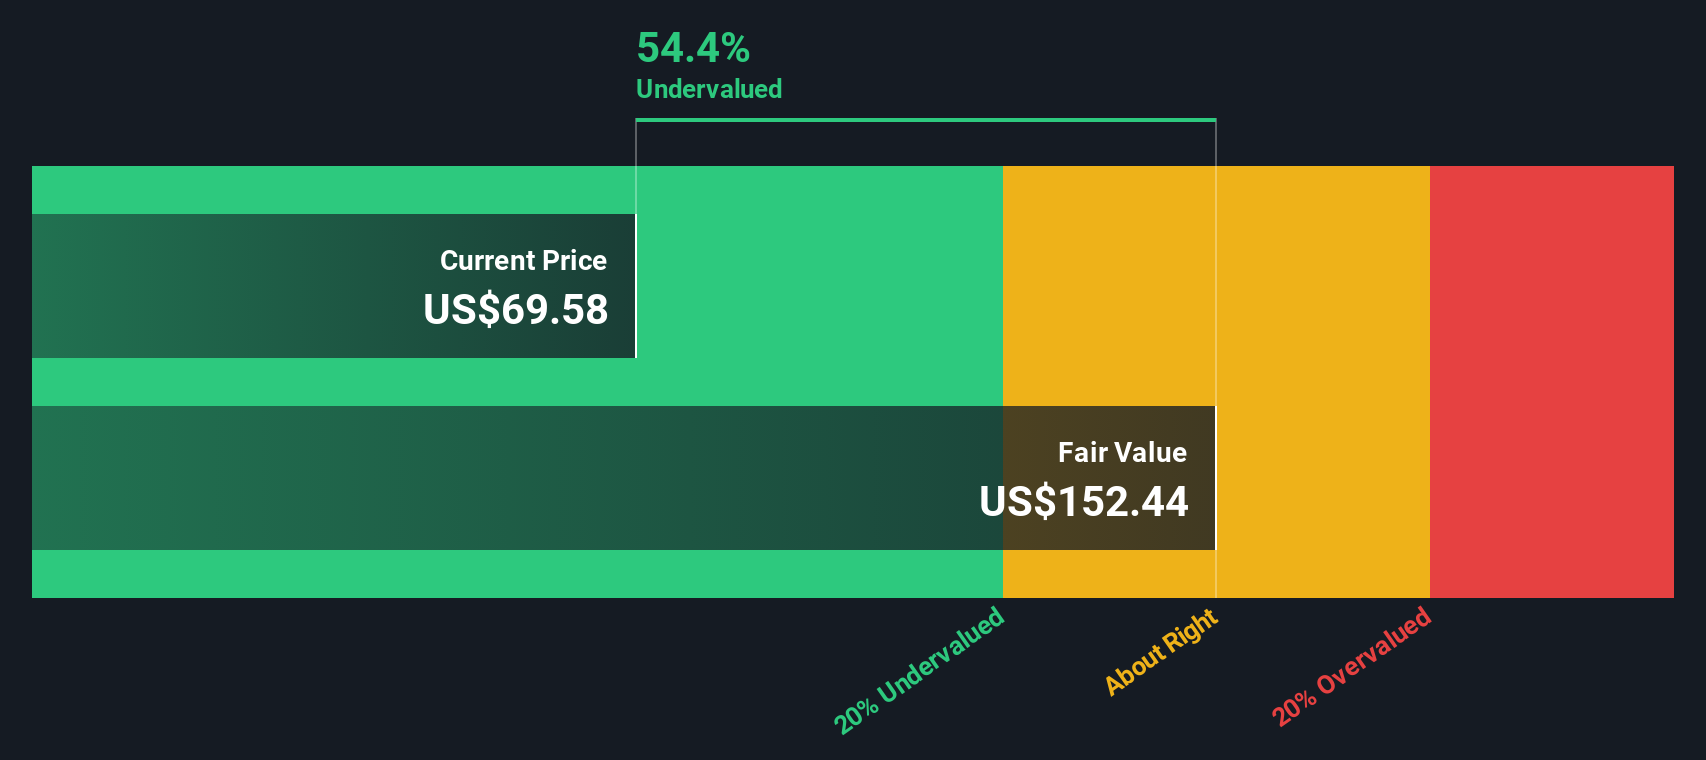
Putting it together, the model arrives at an estimated intrinsic value of US$188.74 per share, which implies a 54.4% discount to the recent share price of US$86.11. On this DCF view, the shares appear materially undervalued relative to this model’s estimate of intrinsic value.
Result: UNDERVALUED
Our Discounted Cash Flow (DCF) analysis suggests ONEOK is undervalued by 54.4%. Track this in your watchlist or portfolio, or discover 55 more high quality undervalued stocks.
Approach 2: ONEOK Price vs Earnings
For profitable companies, the P/E ratio is a useful shorthand because it links what you pay for the stock to the earnings the business is already generating. It gives you a quick way to judge how much the market is willing to pay for each dollar of earnings.
What counts as a “normal” or “fair” P/E depends on how the market views a company’s growth prospects and risk. Higher expected growth and lower perceived risk can justify a higher multiple, while slower growth or higher risk typically point to a lower one.
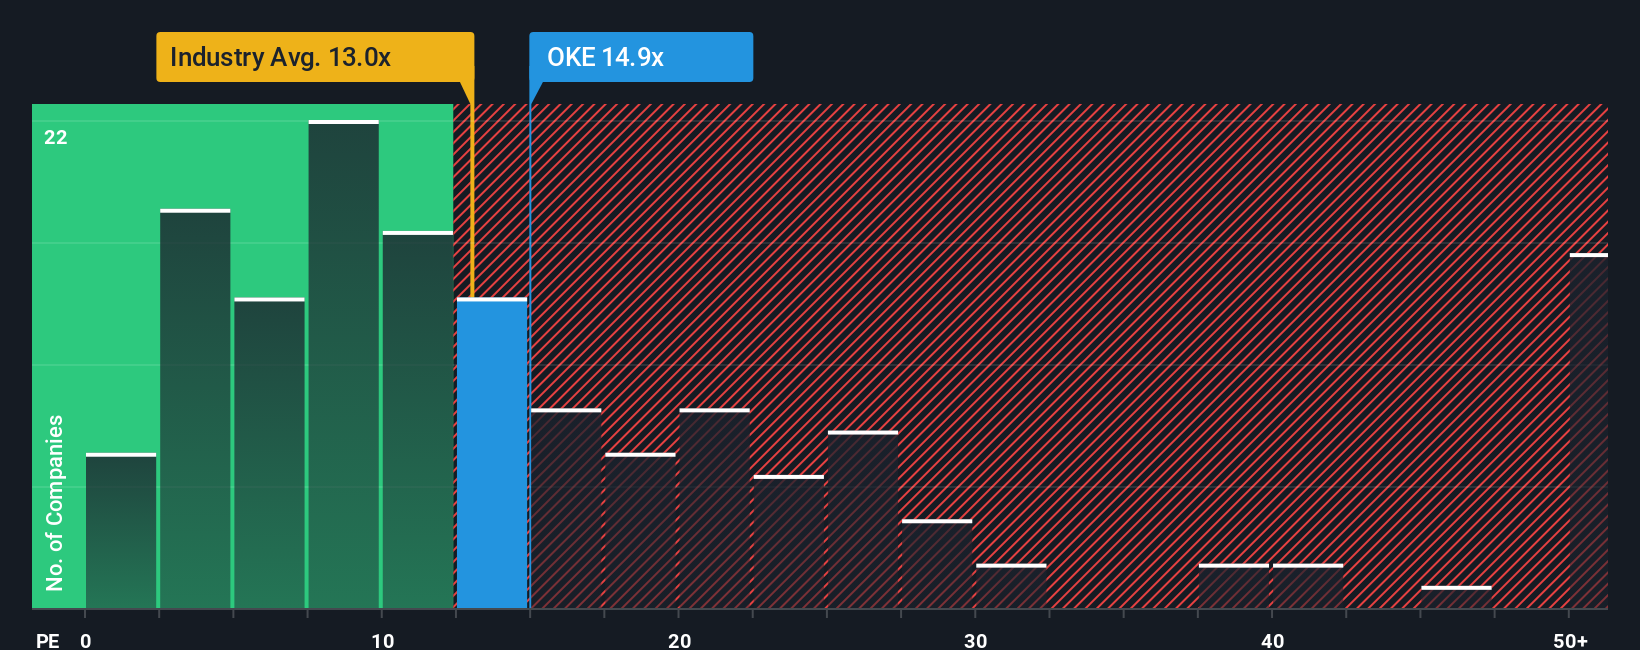
ONEOK currently trades on a P/E of 16.23x. That sits above the Oil and Gas industry average of about 14.46x, but below the broader peer group average of 17.57x. Simply Wall St also calculates a proprietary “Fair Ratio” of 22.18x for ONEOK. This Fair Ratio estimates the P/E you might expect given factors such as its earnings profile, industry, profit margins, market cap and risk characteristics.
Because the Fair Ratio pulls these company specific inputs together, it can be more informative than a simple comparison with industry or peer averages. With the Fair Ratio of 22.18x sitting meaningfully above the current 16.23x, ONEOK appears undervalued on this P/E based view.
Result: UNDERVALUED
P/E ratios tell one story, but what if the real opportunity lies elsewhere? Start investing in legacies, not executives. Discover our 23 top founder-led companies.
Upgrade Your Decision Making: Choose your ONEOK Narrative
Earlier we mentioned that there is an even better way to understand valuation, so let us introduce you to Narratives. Narratives let you turn your view of ONEOK into a simple story that links assumptions about future revenue, earnings and margins to a forecast and then to a Fair Value you can compare with the current price. All of this happens within the Simply Wall St Community page, where these Narratives update automatically when new earnings or news arrive. They can span anything from a more cautious view closer to a US$72 Fair Value through to a more optimistic stance around US$118, giving you a clear, accessible framework to judge whether the current price looks high or low for your chosen story.
For ONEOK however we will make it really easy for you with previews of two leading ONEOK Narratives:
Here is how a more optimistic and a more cautious view line up side by side so you can see which one feels closer to your own expectations.
Fair value: US$87.30 per share
Implied pricing gap vs last close: about 1.4% below this fair value estimate
Revenue growth assumption: 3.21% a year
- Assumes ONEOK keeps building out its U.S. midstream network, including export and basin infrastructure, with those assets supporting steady revenue and margin improvement over time.
- Analysts in this camp are baking in higher free cash flow and lower leverage, which they see as giving management room to balance dividends, reinvestment and other capital decisions.
- This view leans on the idea that the market eventually assigns a higher P/E multiple if execution stays on track and earnings follow the current consensus path.
Fair value: US$72.00 per share
Implied pricing gap vs last close: about 19.6% above this fair value estimate
Revenue growth assumption: 2.00% a year
- This more cautious view expects slower revenue growth, with tighter commodity spreads, ongoing capital spending and regulatory pressures weighing on how much earnings can expand.
- It highlights risks around reliance on hydrocarbon infrastructure, including the possibility that changing energy policies and technology trends reduce long term demand for some assets.
- Analysts behind this narrative apply a lower future P/E multiple, reflecting concerns that investors may not be willing to pay as much for each dollar of earnings if growth and execution stay under pressure.
If you want to see how other investors are framing these stories in full, you can use the Bull and Bear Narratives as a starting point, then adjust the revenue, margin and valuation assumptions until they line up with your own view of ONEOK.
Do you think there's more to the story for ONEOK? Head over to our Community to see what others are saying!

This article by Simply Wall St is general in nature. We provide commentary based on historical data and analyst forecasts only using an unbiased methodology and our articles are not intended to be financial advice. It does not constitute a recommendation to buy or sell any stock, and does not take account of your objectives, or your financial situation. We aim to bring you long-term focused analysis driven by fundamental data. Note that our analysis may not factor in the latest price-sensitive company announcements or qualitative material. Simply Wall St has no position in any stocks mentioned.