

Is Opera (OPRA) Still Attractive After Recent Nasdaq Software Sector Interest?
OPERA LTD OPRA | 0.00 |
- This article examines whether Opera's recent share price movements have left the stock looking expensive or still potentially priced for value, and explains what the current valuation reflects.
- With the stock last closing at US$17.12 and total returns of 16.1% over 7 days, 17.1% over 30 days, 20.3% year to date, 25.2% over 1 year, 79.7% over 3 years and 118.9% over 5 years, many investors are reassessing what might be priced into Opera today.
- Recent news coverage has focused on Opera's role as a software and browser company and how that positioning aligns with shifts in user behavior and digital advertising. This helps explain why investors are paying closer attention to the stock. Headlines have also highlighted the broader interest in software names on the Nasdaq, providing more context for Opera's recent trading activity.
- Opera currently holds a valuation score of 6 out of 6, based on checks that assess whether the shares look undervalued. The next sections will compare this with traditional methods such as P/E and DCF, and will conclude with a more comprehensive way to think about what the market might be missing.
Approach 1: Opera Discounted Cash Flow (DCF) Analysis
A Discounted Cash Flow, or DCF, model estimates what a company could be worth by projecting its future cash flows and discounting them back to today using a required rate of return. It is essentially asking what those future dollars are worth in present terms.
For Opera, the model uses a 2 Stage Free Cash Flow to Equity approach based on cash flow projections. The latest twelve month free cash flow is about $96.2 million. Analyst estimates and extrapolations by Simply Wall St project free cash flow rising to $276.9 million in 2030, with interim projections such as $147.0 million in 2026 and $184.5 million in 2027, all expressed in $ and then discounted back to today.
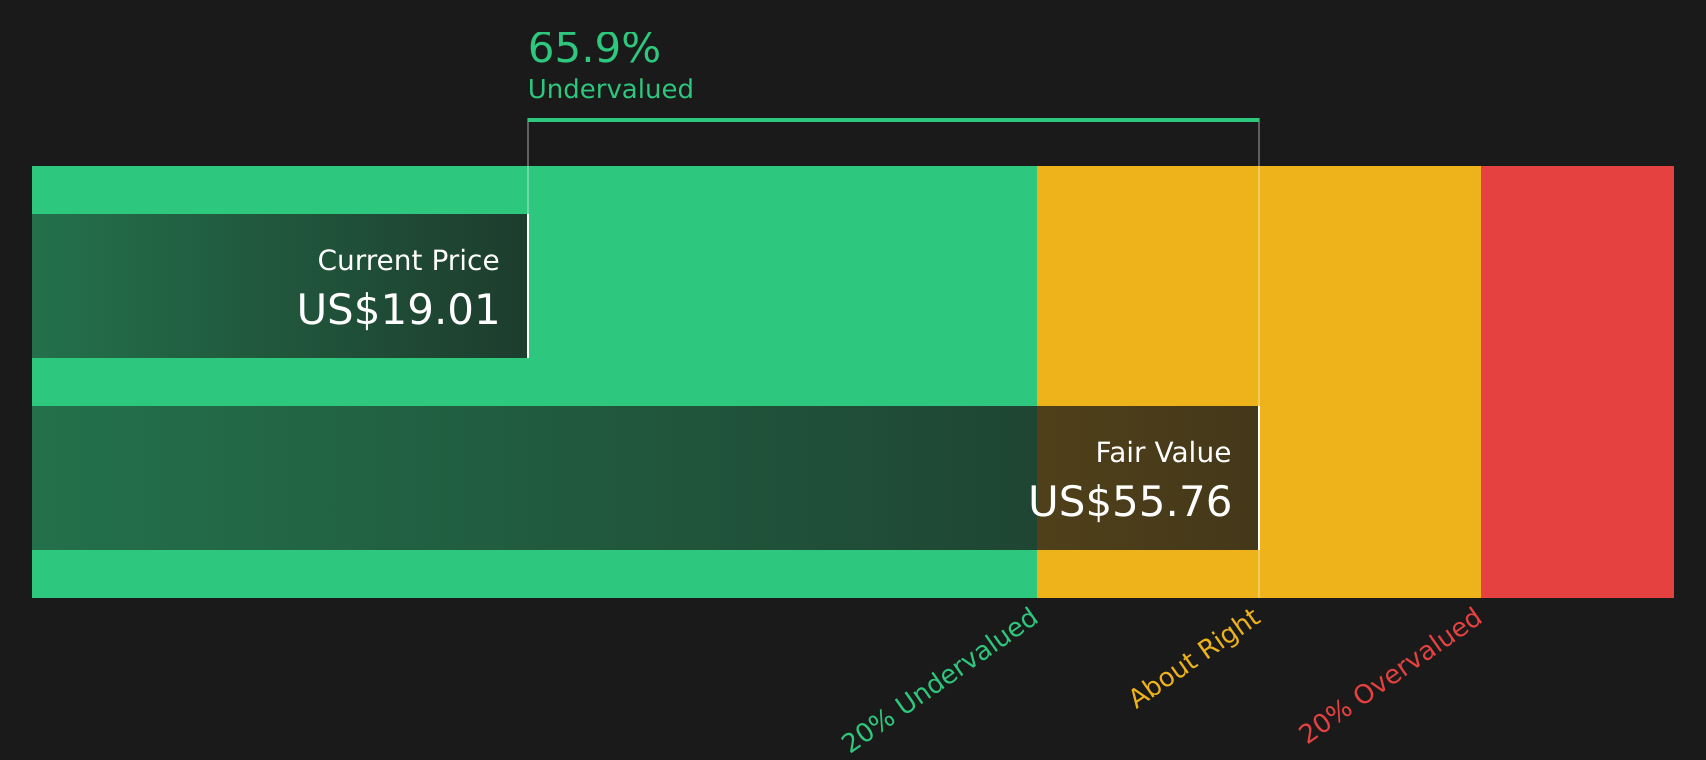
Bringing all those discounted cash flows together gives an estimated intrinsic value of $62.24 per share. Compared with the recent share price of $17.12, this model suggests the stock trades at about a 72.5% discount to that intrinsic estimate. This points to a wide gap between price and this particular valuation output.
Result: UNDERVALUED
Our Discounted Cash Flow (DCF) analysis suggests Opera is undervalued by 72.5%. Track this in your watchlist or portfolio, or discover 59 more high quality undervalued stocks.
Approach 2: Opera Price vs Earnings (P/E)
For profitable companies, the P/E ratio is a straightforward way to gauge how much you are paying for each dollar of earnings. This makes it a useful cross check against the DCF result. What counts as a normal or fair P/E depends on how the market views a company’s growth prospects and risk profile, with higher growth or perceived resilience often justifying a higher multiple, and higher risk or weaker outlook tending to cap it.
Opera currently trades on a P/E of 14.17x, compared with the broader Software industry average of 29.07x and a peer group average of 31.87x. Simply Wall St also calculates a proprietary Fair Ratio for Opera of 26.13x, which is the P/E level that would typically be expected after considering factors such as Opera’s earnings growth profile, profit margins, industry, market cap and company specific risks. This Fair Ratio can be more informative than a simple industry or peer comparison because it is tailored to Opera’s own fundamentals rather than a broad group of companies.
With Opera’s current P/E of 14.17x sitting well below the Fair Ratio of 26.13x, the shares screen as undervalued on this metric.
Result: UNDERVALUED

P/E ratios tell one story, but what if the real opportunity lies elsewhere? Start investing in legacies, not executives. Discover our 19 top founder-led companies.
Upgrade Your Decision Making: Choose your Opera Narrative
Earlier it was mentioned that there is an even better way to understand valuation, so Narratives are introduced here as simple, investor written stories that sit behind the numbers by spelling out assumptions about Opera's future revenue, earnings and margins, then linking those assumptions to a forecast and a Fair Value that can be compared directly with the current share price.
On Simply Wall St's Community page, Narratives are set up as easy to use templates that let you spell out why you think Opera's browser, MiniPay wallet or AI products matter, connect that view to specific forecasts, and then see the Fair Value that falls out of your story.
Because Narratives live on the platform and are refreshed when new information such as Opera's latest guidance, analyst target changes or product news arrives, the Fair Value and key drivers update in step so you can quickly see whether your story still fits the price.
For Opera today, one investor narrative might anchor on a lower Fair Value around $21.50, another might lean toward a higher Fair Value near $32.11, and a third could sit closer to the $25.50 consensus. Yet all three are simply different stories about the same company, written down with clear numbers that you can compare with the current share price of US$17.12.
Do you think there's more to the story for Opera? Head over to our Community to see what others are saying!

This article by Simply Wall St is general in nature. We provide commentary based on historical data and analyst forecasts only using an unbiased methodology and our articles are not intended to be financial advice. It does not constitute a recommendation to buy or sell any stock, and does not take account of your objectives, or your financial situation. We aim to bring you long-term focused analysis driven by fundamental data. Note that our analysis may not factor in the latest price-sensitive company announcements or qualitative material. Simply Wall St has no position in any stocks mentioned.