

Is Oppenheimer Holdings (OPY) Fully Valued Following Strong Q2 Earnings?
Oppenheimer Holdings Inc. Class A OPY | 0.00 |
Why Oppenheimer Holdings Stock Is Back in Focus After Q2 Results
Oppenheimer Holdings (OPY) moved back onto investor watchlists after reporting second quarter 2026 earnings that showed higher revenue and net income versus a year earlier, alongside an affirmed quarterly dividend.
The 1 day share price return of 1.47% to US$114.81 came after Oppenheimer Holdings reported higher second quarter revenue and earnings. This follows a 90 day share price return of 20.22% and a 1 year total shareholder return of 60.34%, suggesting momentum has been building over both the short and longer term.
If strong recent gains at Oppenheimer have your attention, it can be useful to widen the lens and see what else is moving by checking out 19 top founder-led companies
Bulls point to Oppenheimer Holdings’ strong Q2 and long term share gains. Bears flag the weaker year to date earnings picture. To see which side current conditions support, it helps to step through what the valuation is implying next.
Price-to-Earnings of 12x for Oppenheimer Holdings: Is It Justified?
On a simple earnings yardstick, Oppenheimer Holdings trades on a P/E of 12x, which sits at a lower level than many peers despite the recent share price run.
The P/E ratio compares the current share price to the company’s earnings per share, so a lower figure often means investors are paying less for each dollar of profit. For a middle market investment bank and broker dealer such as Oppenheimer Holdings, this measure is a common shorthand for how the market is valuing its profit stream.
Here, the P/E of 12x is below both the broader US market P/E of 19.2x and the US Capital Markets industry average of 37.4x. It is also below the peer average of 19.7x. Those gaps are wide and suggest the market currently values Oppenheimer Holdings’ earnings at a discount compared with both its direct industry group and the wider market.
Result: Price-to-Earnings of 12x (UNDERVALUED)
However, you also need to weigh risks such as softer year to date earnings and the possibility that Oppenheimer Holdings’ discount reflects business mix or cyclical exposure.
Another View on Oppenheimer Holdings Using Our DCF Model
The P/E of 12x makes Oppenheimer Holdings look inexpensive, but the SWS DCF model points in a different direction. At a share price of US$114.81 and a future cash flow value estimate of US$70.74, the stock screens as overvalued on this approach. Which signal should carry more weight for you right now?
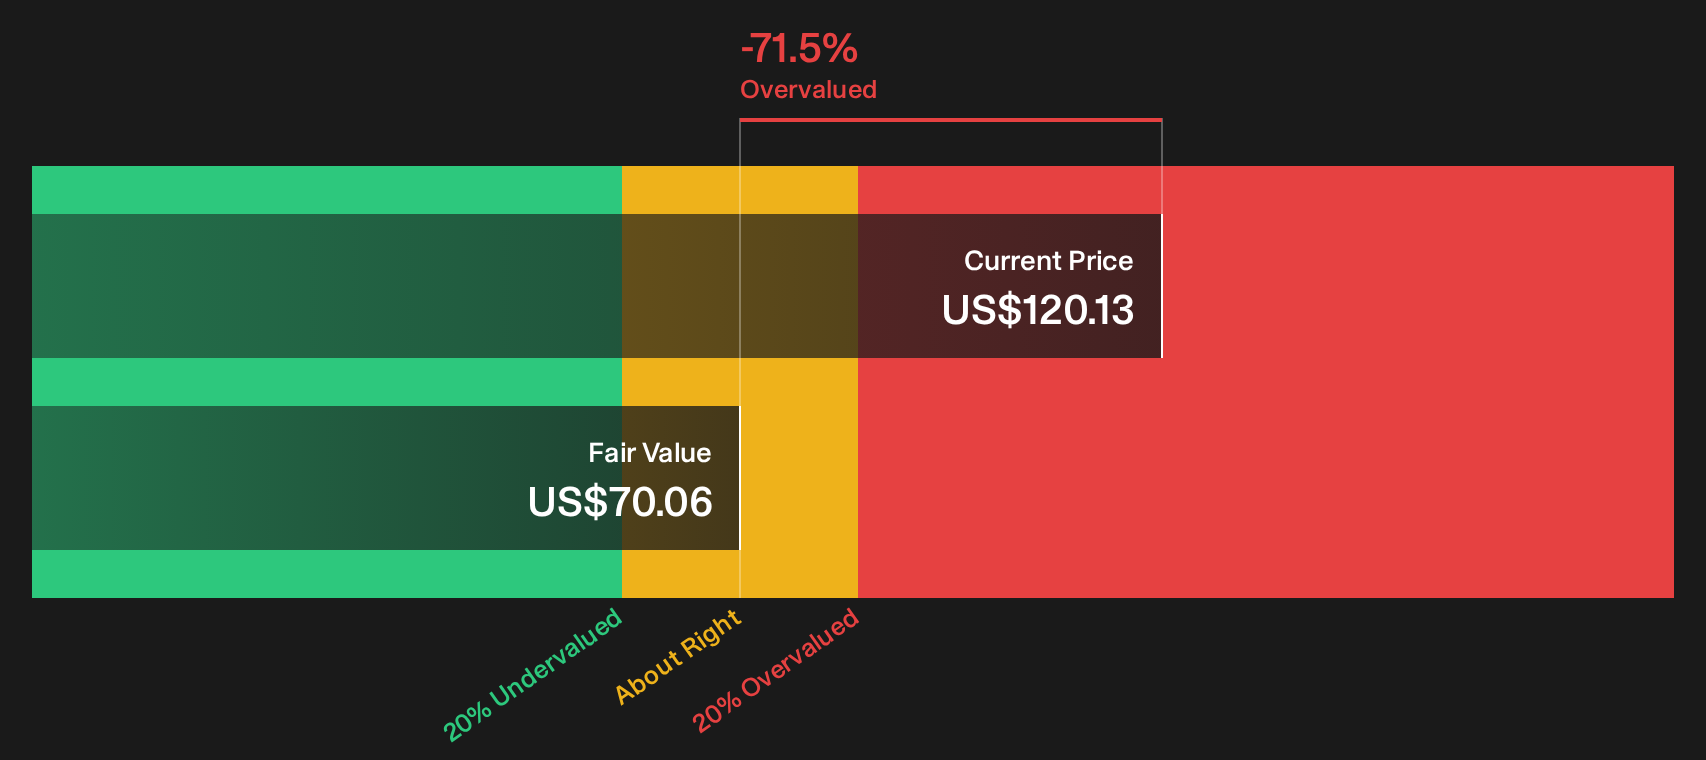
Simply Wall St performs a discounted cash flow (DCF) on every stock in the world every day (check out Oppenheimer Holdings for example). We show the entire calculation in full. You can track the result in your watchlist or portfolio and be alerted when this changes, or use our stock screener to discover 49 high quality undervalued stocks. If you save a screener we even alert you when new companies match - so you never miss a potential opportunity.
Next Steps
After considering both the upbeat and the more cautious signals around Oppenheimer Holdings, it may be helpful to review the data yourself and decide where you stand. To see both perspectives summarized in one place, review the 1 key reward and 1 important warning sign
Looking for more investment ideas beyond Oppenheimer Holdings?
If you only stop at Oppenheimer Holdings, you might miss out on other opportunities that fit your goals. Use the Simply Wall St Screener to quickly shortlist stocks that match the kind of portfolio you actually want to build.
- Target potential long term compounders by checking companies that look attractively priced on fundamentals through the 49 high quality undervalued stocks.
- Strengthen your income stream by reviewing stocks with higher yields and a focus on durability using the 9 dividend fortresses.
- Keep your risk in check by scanning for companies with sturdier financial profiles through the 85 resilient stocks with low risk scores.
This article by Simply Wall St is general in nature. We provide commentary based on historical data and analyst forecasts only using an unbiased methodology and our articles are not intended to be financial advice. It does not constitute a recommendation to buy or sell any stock, and does not take account of your objectives, or your financial situation. We aim to bring you long-term focused analysis driven by fundamental data. Note that our analysis may not factor in the latest price-sensitive company announcements or qualitative material. Simply Wall St has no position in any stocks mentioned.