Is Oruka Therapeutics’ (ORKA) ESOP Shelf Registration Quietly Redefining Its Funding Playbook?
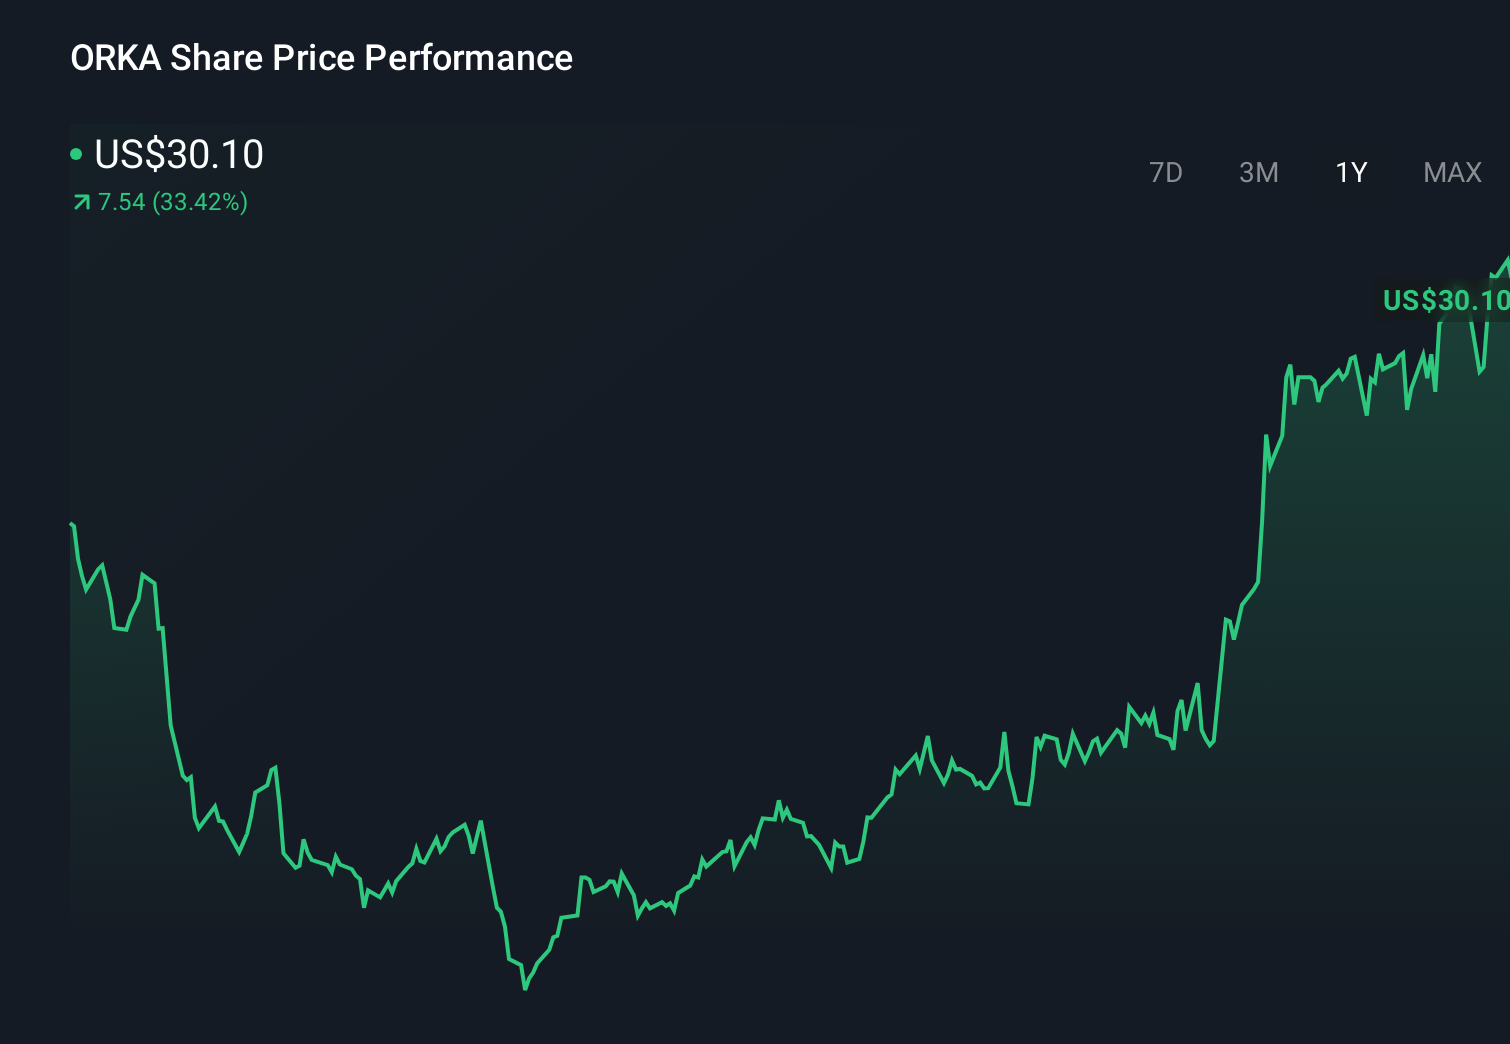
Oruka Therapeutics, Inc. ORKA | 53.31 | +5.71% |
- Oruka Therapeutics, Inc. recently reported fourth-quarter 2025 results showing a net loss of US$29.58 million and a full-year 2025 net loss of US$105.43 million, alongside narrowing quarterly loss per share from continuing operations to US$0.45.
- On the same day, the company filed a US$115.44 million shelf registration for 3,354,715 ordinary shares tied to an ESOP-related offering, highlighting its focus on funding flexibility while advancing mid-stage trials for ORKA-002 in psoriasis and hidradenitis suppurativa.
- Against this backdrop, we’ll examine how the ESOP-related US$115.44 million shelf registration shapes Oruka Therapeutics’ investment narrative for investors.
Find 49 companies with promising cash flow potential yet trading below their fair value.
What Is Oruka Therapeutics' Investment Narrative?
To own Oruka Therapeutics, you need to believe that its long-acting dermatology antibodies can move successfully through mid‑stage trials and eventually justify today’s valuation despite persistent losses and no revenue. The latest results simply reinforce the current burn profile, with a full-year 2025 net loss of US$105.43 million and no clear path to near-term profitability. The more interesting piece of news is the US$115.44 million ESOP-related shelf registration, which adds funding flexibility without immediately changing the core clinical catalysts: Phase 2 ORCA-SURGE in psoriasis, the planned Phase 2 in hidradenitis suppurativa, and EVERLAST data milestones. For now, the key risks remain execution in these trials, ongoing cash needs, and potential dilution, with the shelf filing fitting neatly into that existing risk-reward equation rather than redefining it.
However, one risk around future funding and dilution is something investors should be very clear on. According our valuation report, there's an indication that Oruka Therapeutics' share price might be on the expensive side.Exploring Other Perspectives
Explore 2 other fair value estimates on Oruka Therapeutics - why the stock might be worth as much as 45% more than the current price!
Reach Your Own Conclusion
Don't just follow the ticker - dig into the data and build a conviction that's truly your own.
- A great starting point for your Oruka Therapeutics research is our analysis highlighting 5 important warning signs that could impact your investment decision.
- Our free Oruka Therapeutics research report provides a comprehensive fundamental analysis summarized in a single visual - the Snowflake - making it easy to evaluate Oruka Therapeutics' overall financial health at a glance.
Searching For A Fresh Perspective?
Right now could be the best entry point. These picks are fresh from our daily scans. Don't delay:
- The future of work is here. Discover the 30 top robotics and automation stocks leading the charge in AI-driven automation and industrial transformation.
- Invest in the nuclear renaissance through our list of 87 elite nuclear energy infrastructure plays powering the global AI revolution.
- Uncover the next big thing with 33 elite penny stocks that balance risk and reward.
This article by Simply Wall St is general in nature. We provide commentary based on historical data and analyst forecasts only using an unbiased methodology and our articles are not intended to be financial advice. It does not constitute a recommendation to buy or sell any stock, and does not take account of your objectives, or your financial situation. We aim to bring you long-term focused analysis driven by fundamental data. Note that our analysis may not factor in the latest price-sensitive company announcements or qualitative material. Simply Wall St has no position in any stocks mentioned.