Is Phillips 66 (PSX) Still Attractively Priced After Its Strong Multi‑Year Share Price Run
Phillips 66 PSX | 176.21 | +0.32% |
- If you are wondering whether Phillips 66 is still attractively priced after its recent run, this breakdown will help you see what the current share price might be implying.
- The stock last closed at US$154.43, with returns of 7.2% over the past week, 13.0% over the past month, 18.3% year to date and 32.6% over the past year, alongside 68.6% over three years and 143.1% over five years.
- Recent coverage around Phillips 66 has focused on how investors are reassessing refiners and energy infrastructure companies, with attention on capital allocation, asset quality and exposure across the energy value chain. This backdrop helps frame why the stock's recent price moves have drawn more interest from both long term holders and new investors.
- On our checklist of 6 valuation tests, Phillips 66 scores a 4. This means it screens as undervalued on most, but not all, of them. Next we will walk through these approaches before finishing with a way to tie them together into a clearer view of value.
Approach 1: Phillips 66 Discounted Cash Flow (DCF) Analysis
A Discounted Cash Flow, or DCF, model estimates what a company might be worth by projecting its future cash flows and discounting them back to today, so you can compare that value to the current share price.
For Phillips 66, the model uses a 2 Stage Free Cash Flow to Equity approach based on cash flow projections. The latest twelve month free cash flow is about US$3.0b. Analyst inputs and extrapolated estimates point to free cash flow of US$3.97b in 2026 and US$5.85b by 2027, with Simply Wall St extending these projections out over ten years using its own growth assumptions.
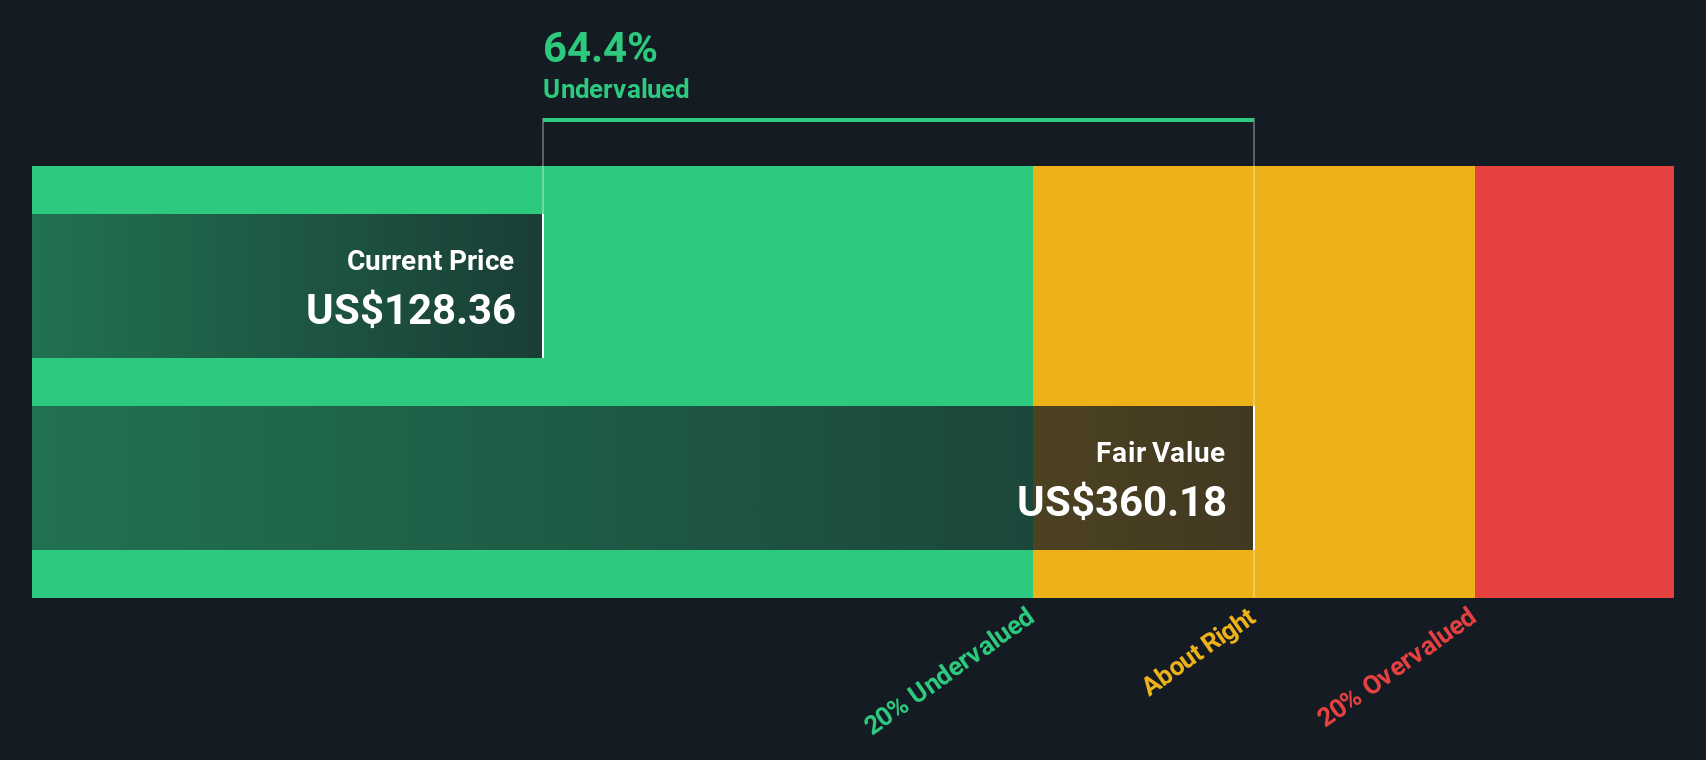
Adding up those discounted cash flows, the model arrives at an estimated intrinsic value of about US$666.41 per share. Compared to the recent share price of US$154.43, this DCF suggests that Phillips 66 trades at a 76.8% discount to that estimate, which indicates that the stock screens as materially undervalued on this methodology.
Result: UNDERVALUED
Our Discounted Cash Flow (DCF) analysis suggests Phillips 66 is undervalued by 76.8%. Track this in your watchlist or portfolio, or discover 55 more high quality undervalued stocks.
Approach 2: Phillips 66 Price vs Earnings
For a profitable company like Phillips 66, the P/E ratio is a straightforward way to see what the market is paying for each dollar of earnings. Investors usually look for a P/E that lines up with their expectations for future growth and the level of risk they are taking on, since higher growth or lower perceived risk often goes with a higher “normal” P/E, and the opposite is also true.
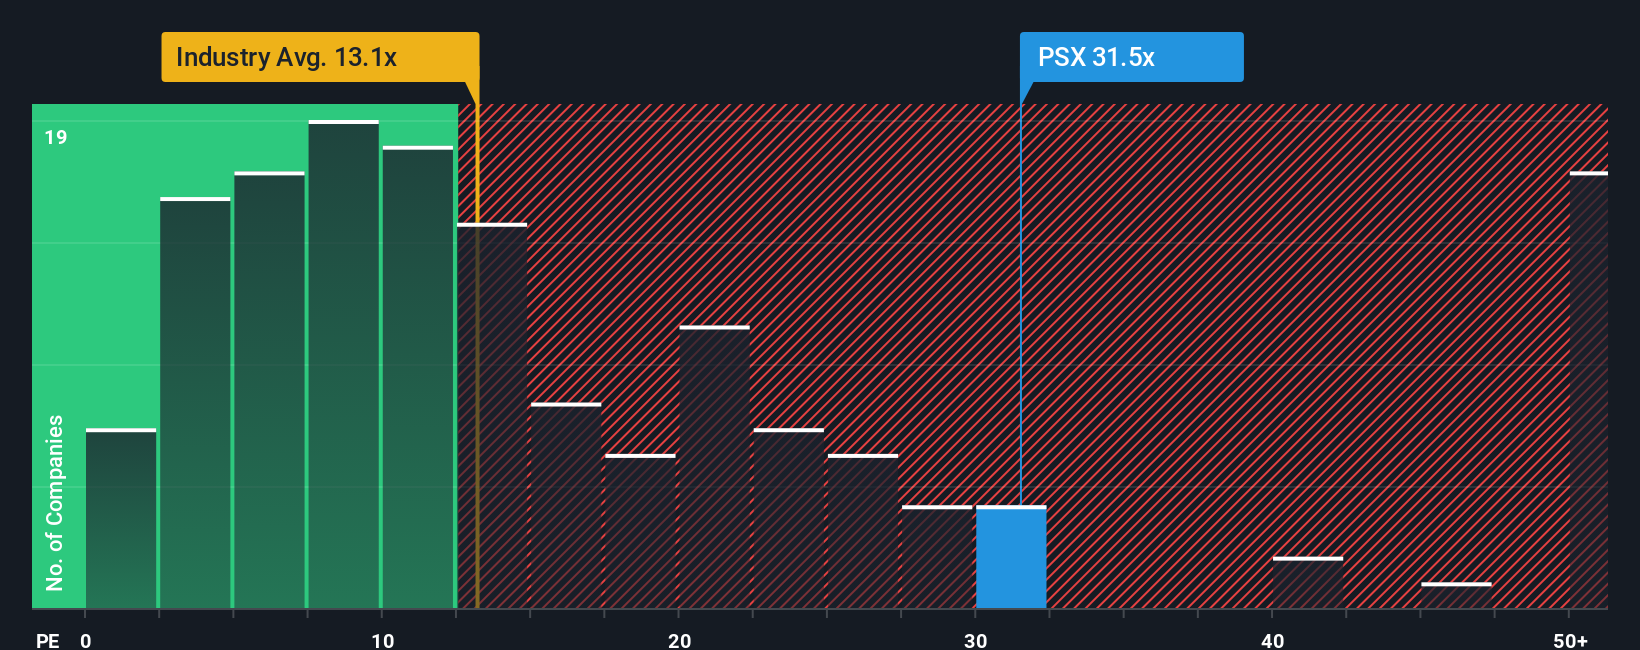
Phillips 66 currently trades on a P/E of 14.13x. That figure is in line with the Oil and Gas industry average P/E of 14.13x, and below the broader peer group average of 23.35x. Simply Wall St also calculates a “Fair Ratio” of 21.99x for Phillips 66, which is the P/E it might trade on given its earnings growth profile, margins, industry, market cap and risk factors.
This Fair Ratio is more tailored than a simple comparison to peers or the sector because it adjusts for company specific characteristics instead of assuming that one size fits all. Comparing the current P/E of 14.13x with the Fair Ratio of 21.99x suggests that the shares screen as undervalued on this metric.
Result: UNDERVALUED
P/E ratios tell one story, but what if the real opportunity lies elsewhere? Start investing in legacies, not executives. Discover our 22 top founder-led companies.
Upgrade Your Decision Making: Choose your Phillips 66 Narrative
Earlier we mentioned that there is an even better way to understand valuation, so let us introduce you to Narratives, which are Simply Wall St’s way of letting you attach a clear story to your numbers, including your fair value, and your expectations for Phillips 66’s future revenue, earnings and margins.
A Narrative is your view of what is really happening at a company, linked directly to a financial forecast and then to a fair value that you can compare with today’s share price. On Simply Wall St’s Community page, where millions of investors share ideas, Narratives are designed to be easy to set up and adjust, so you can quickly see whether your view suggests Phillips 66 looks expensive, fairly priced or cheap relative to your own Fair Value estimate. When new information comes in, like earnings or news, the inputs and fair value in a Narrative update, so you always see a live view of what your story implies. For example, one Phillips 66 Narrative on the Community page might assume very optimistic revenue growth and a high Fair Value, while another might expect slower growth and a lower Fair Value, leading those investors to very different decisions when they compare their Fair Values to the current price.
Do you think there's more to the story for Phillips 66? Head over to our Community to see what others are saying!

This article by Simply Wall St is general in nature. We provide commentary based on historical data and analyst forecasts only using an unbiased methodology and our articles are not intended to be financial advice. It does not constitute a recommendation to buy or sell any stock, and does not take account of your objectives, or your financial situation. We aim to bring you long-term focused analysis driven by fundamental data. Note that our analysis may not factor in the latest price-sensitive company announcements or qualitative material. Simply Wall St has no position in any stocks mentioned.