Is Plug Power (PLUG) Pricing Aligning With Its Volatile Track Record And Cash Flow Outlook
Plug Power Inc. PLUG | 2.93 2.96 | 0.00% +1.07% Pre |
- If you are wondering whether Plug Power's current share price reflects its true potential or its risks, you are not alone. This article focuses squarely on what the numbers say about value.
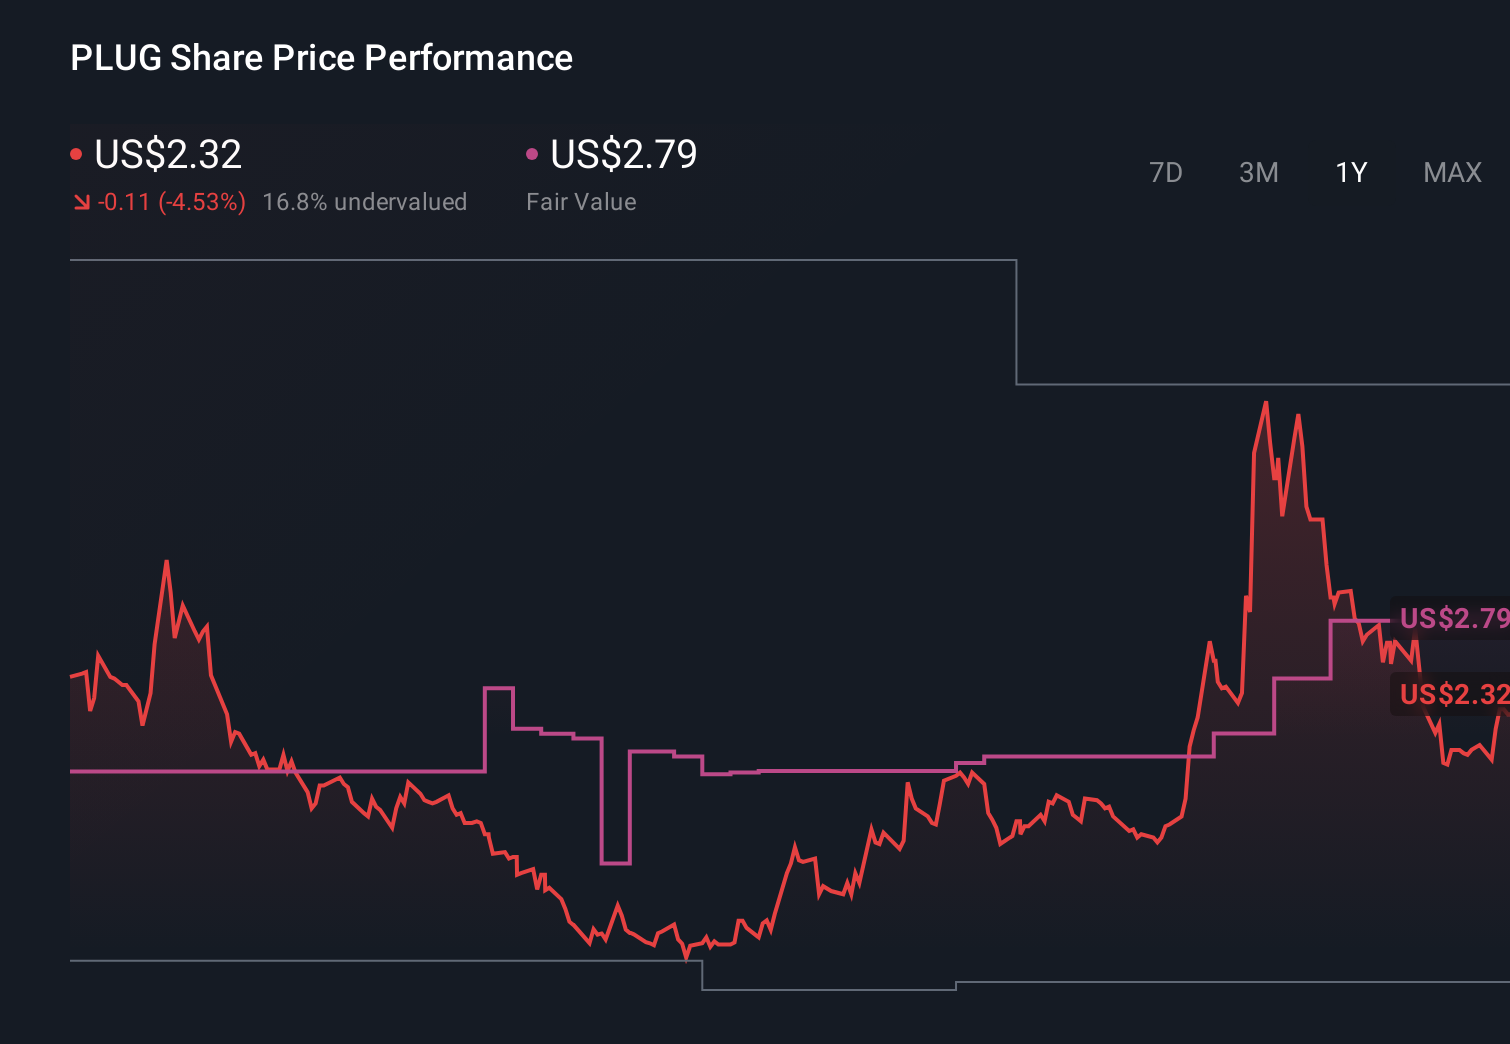
- Plug Power's stock has been volatile, with a 1 year return of 12.8% contrasted against a 3 year return of 86.5% decline and a 5 year return of 96.7% decline, while the year to date return sits at 7.0% decline.
- Recent attention on hydrogen and fuel cell companies has kept Plug Power on many investors' watchlists, particularly as sentiment around clean energy has shifted over time. Broader sector headlines and changing risk appetite have provided the backdrop for Plug Power's move to a last close of US$2.08.
- On our simple valuation checks Plug Power scores 2 out of 6, as shown in its valuation score. Next we will look at what different valuation methods say about that score before finishing with a more holistic way to think about value.
Plug Power scores just 2/6 on our valuation checks. See what other red flags we found in the full valuation breakdown.
Approach 1: Plug Power Discounted Cash Flow (DCF) Analysis
A Discounted Cash Flow, or DCF, model takes estimates of a company’s future cash flows and discounts them back to today using a required rate of return, to arrive at an estimate of what the business might be worth per share right now.
For Plug Power, the model used is a 2 Stage Free Cash Flow to Equity approach based on cash flow projections. The latest twelve month free cash flow is a loss of about $904.4 million. Analyst inputs and subsequent extrapolations then step through a path where projected free cash flow reaches $466.7 million by 2030, with interim years moving from losses into positive territory according to the supplied schedule of estimates and extensions.
When all of those projected cash flows are discounted back to today, Simply Wall St’s model arrives at an estimated intrinsic value of about $6.83 per share. Compared with the recent share price of roughly $2.08, this DCF output implies an intrinsic discount of 69.6%. This indicates that the shares are currently priced well below this cash flow based estimate.
Result: UNDERVALUED
Our Discounted Cash Flow (DCF) analysis suggests Plug Power is undervalued by 69.6%. Track this in your watchlist or portfolio, or discover 52 more high quality undervalued stocks.

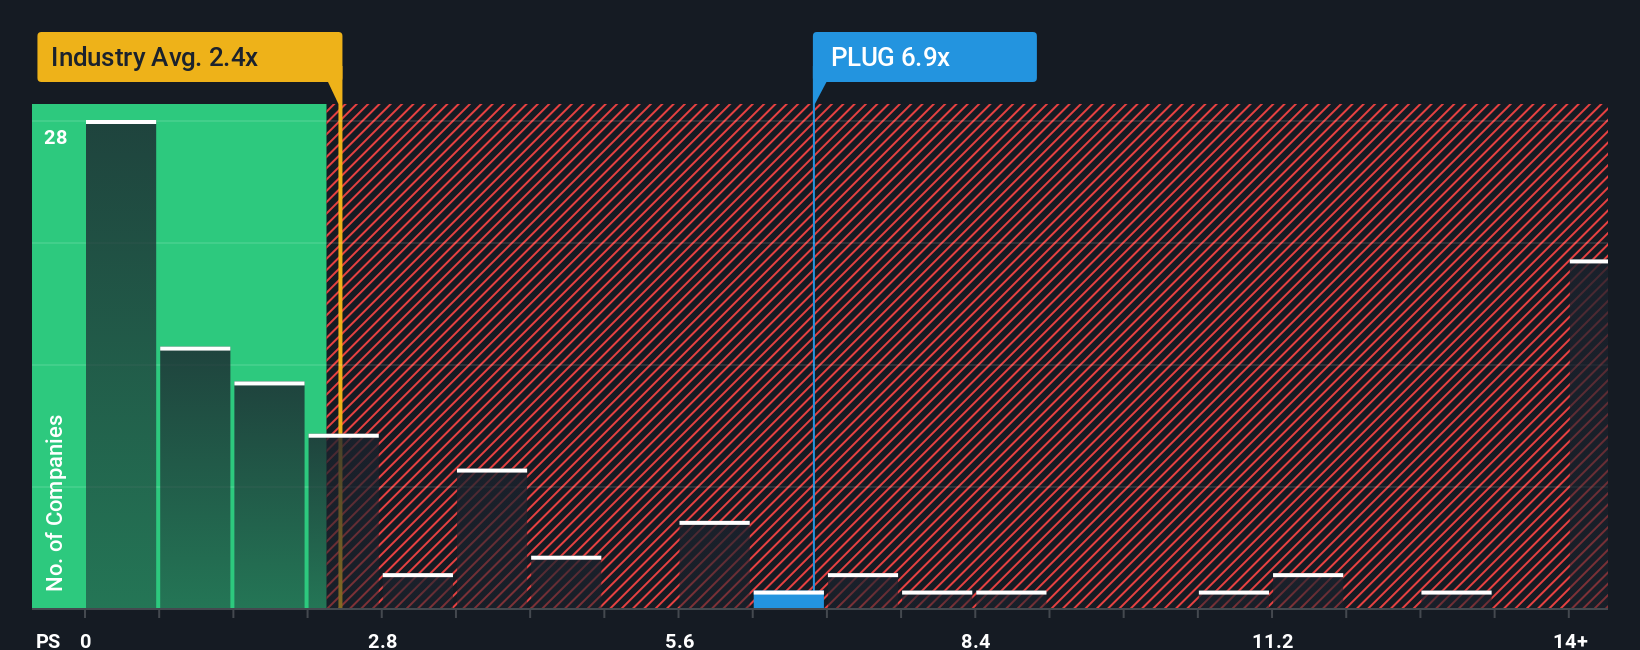
Approach 2: Plug Power Price vs Sales
For companies where profits are limited or inconsistent, investors often lean on the Price to Sales, or P/S, ratio because revenue is usually more stable and easier to compare than earnings. It gives a quick sense of how much the market is paying for each dollar of sales.
What counts as a “normal” P/S ratio tends to reflect expectations for future growth and the level of business risk the market sees. Higher expected growth or lower perceived risk usually go with a higher multiple, while lower growth or higher risk often go with a lower one.
Plug Power currently trades on a P/S of 4.21x. That sits above the Electrical industry average P/S of 2.47x and also above the peer average of 1.48x. Simply Wall St’s Fair Ratio model estimates a P/S of 0.22x for Plug Power, based on factors such as its earnings profile, industry, profit margins, market cap and company specific risks. This Fair Ratio can be more informative than a simple peer or industry comparison because it adjusts the multiple to the company’s own fundamentals rather than assuming it should trade like the average stock.
Compared with this Fair Ratio of 0.22x, Plug Power’s current P/S of 4.21x appears high.
Result: OVERVALUED
P/S ratios tell one story, but what if the real opportunity lies elsewhere? Start investing in legacies, not executives. Discover our 22 top founder-led companies.
Upgrade Your Decision Making: Choose your Plug Power Narrative
Earlier we mentioned that there is an even better way to understand valuation, so let us introduce you to Narratives, which simply means you attach a clear story about Plug Power’s future to the numbers you care about, like your own fair value, revenue, earnings and margin estimates.
A Narrative links three things in one place: the company’s story, a financial forecast, and the fair value that drops out of that forecast, so you can see how your view of Plug Power actually translates into a number.
You can build and explore Narratives on Simply Wall St’s Community page, where millions of investors share their views, compare fair values with the current share price, and use that gap to help decide whether Plug Power looks attractive or not for their own approach.
Because Narratives update automatically when new information such as news, filings or earnings is added to the platform, your Plug Power view can stay aligned with the latest data instead of quickly going out of date.
For example, one Plug Power Narrative might assume a very optimistic fair value with strong future margins, while another might set a much lower fair value with more cautious revenue and profitability assumptions, yet both are transparent about how they reach their number.
Do you think there's more to the story for Plug Power? Head over to our Community to see what others are saying!
This article by Simply Wall St is general in nature. We provide commentary based on historical data and analyst forecasts only using an unbiased methodology and our articles are not intended to be financial advice. It does not constitute a recommendation to buy or sell any stock, and does not take account of your objectives, or your financial situation. We aim to bring you long-term focused analysis driven by fundamental data. Note that our analysis may not factor in the latest price-sensitive company announcements or qualitative material. Simply Wall St has no position in any stocks mentioned.