

Is Polaris (PII) Still Attractive After An 84% One Year Share Price Rebound?
Polaris Inc. PII | 0.00 |
- Wondering whether Polaris is offering real value at today's share price, or if the recent excitement has already been priced in?
- The stock closed at US$60.04, with returns of 3.7% over 7 days, 5.7% over 30 days, an 83.8% gain over 1 year, but declines of 37.9% over 3 years and 49.6% over 5 years. This mixed performance can change how you think about both risk and opportunity.
- Recent coverage around Polaris has focused on how this rebound sits against a tougher multi year track record, prompting questions about whether the share price now fairly reflects the business. That context is important if you are trying to work out whether the 1 year performance is a reset or a temporary swing.
- Simply Wall St assigns Polaris a value score of 3 out of 6, based on how often it screens as undervalued across six separate checks. The next sections will walk through those traditional valuation approaches and will also point to a broader way to think about what the stock is really worth by the end of the article.
Approach 1: Polaris Discounted Cash Flow (DCF) Analysis
A Discounted Cash Flow model estimates what a company could be worth by projecting future cash flows and then discounting them back to today, so you can compare that value to the current share price.
For Polaris, the model uses a 2 Stage Free Cash Flow to Equity approach based on cash flow projections. The latest twelve month free cash flow is about $477.3 million. Analysts provide forecasts for the next few years, and Simply Wall St extends those into longer term estimates. In this case, projected free cash flow for 2035 is about $134.3 million, with each year between now and then discounted back to reflect the time value of money.
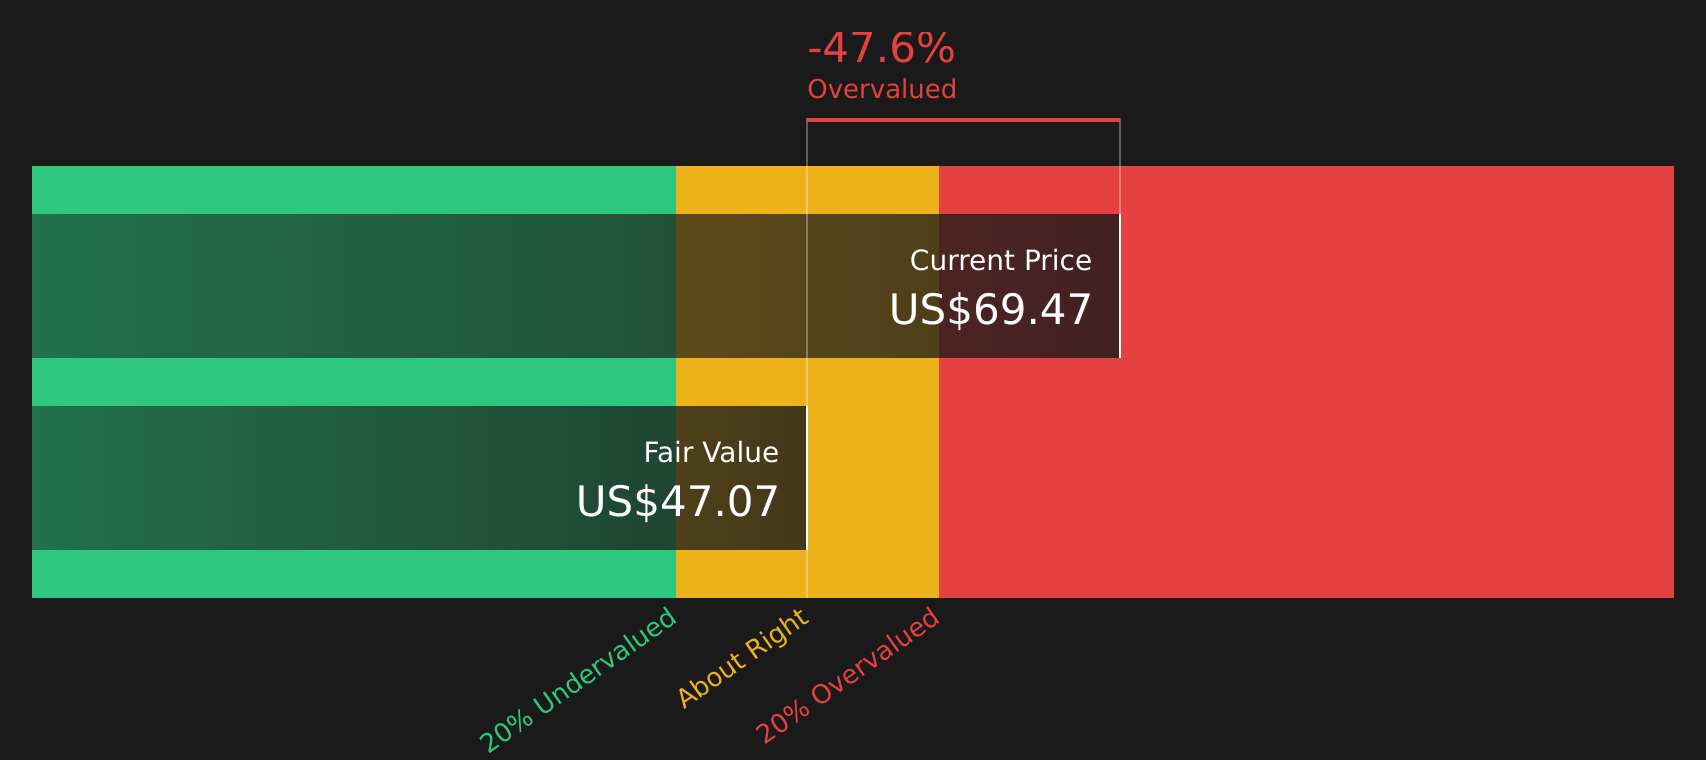
Adding those discounted cash flows together produces an estimated intrinsic value of about $42.01 per share. Compared with the recent share price of $60.04, this implies the stock is around 42.9% above the DCF estimate, which the model interprets as overvalued on this cash flow view.
Result: OVERVALUED
Our Discounted Cash Flow (DCF) analysis suggests Polaris may be overvalued by 42.9%. Discover 55 high quality undervalued stocks or create your own screener to find better value opportunities.
Approach 2: Polaris Price vs Sales
For companies where earnings can be uneven, price to sales is often a useful cross check because it compares what you pay for each dollar of revenue rather than profit, which can move around more.
Investors usually accept a higher or lower P/S ratio depending on what they expect for future growth and how risky the business looks. Higher growth and lower perceived risk often justify a higher multiple, while slower growth or higher risk usually call for a lower one.
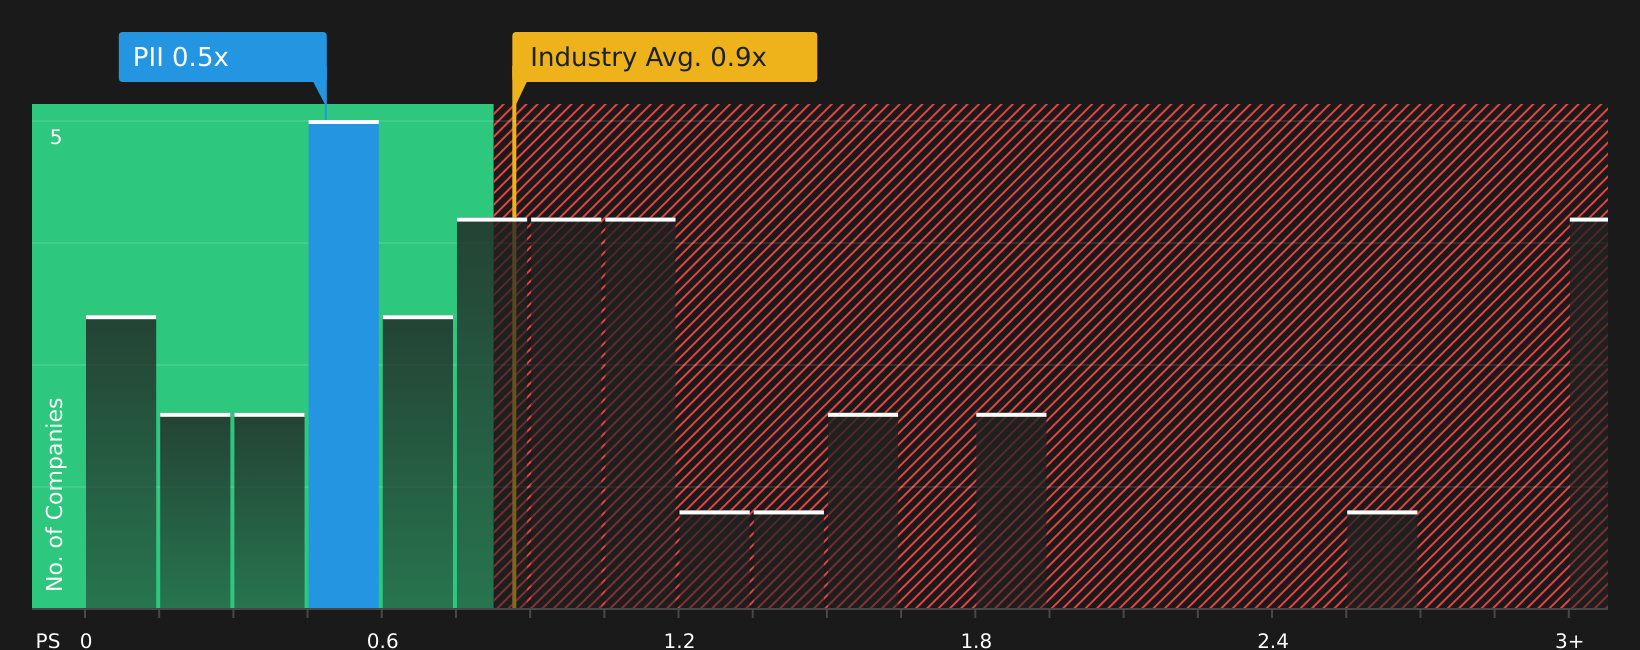
Polaris currently trades on a P/S ratio of 0.47x. That sits below the Leisure industry average of 0.94x and also below the reported peer average of 1.21x. On those simple comparisons, the stock screens as cheaper than many peers in the same space.
Simply Wall St also applies a proprietary “Fair Ratio” for Polaris of 0.59x. This aims to estimate a more tailored multiple by considering factors such as earnings growth, profit margins, risk profile, industry and market cap, rather than relying only on broad peer or industry averages.
Comparing the Fair Ratio of 0.59x with the current 0.47x P/S suggests the shares are trading below that tailored benchmark. This points to the stock being undervalued on this measure.
Result: UNDERVALUED
P/S ratios tell one story, but what if the real opportunity lies elsewhere? Start investing in legacies, not executives. Discover our 18 top founder-led companies.
Upgrade Your Decision Making: Choose your Polaris Narrative
Earlier it was mentioned that there is an even better way to think about valuation, and on Simply Wall St this comes through Narratives. You connect your story about Polaris to specific revenue, earnings and margin assumptions, see how that translates into a fair value, and then compare that to the current price. The tool lives on the Community page and updates automatically as new news or earnings arrive. For example, a cautious Narrative might lean toward the lower analyst fair value of about US$45.33, while a more optimistic Narrative might sit closer to the upper end around US$81.00. This can give you a clear, numbers backed way to decide whether the current price fits your view or not.
For Polaris, however, we will make it really easy for you with previews of two leading Polaris Narratives:
Fair value: US$66.71 per share
Implied pricing gap vs last close: about 10.0% below this fair value
Revenue growth assumption: 2.5% a year
- Analysts are building in steady revenue growth and a shift from a loss today to positive earnings by 2029, with profit margins also improving over that period.
- The thesis leans on margin protection from supply chain and cost control work, plus demand for premium models and new product features across off road, marine and other categories.
- Risks sit around tariffs, a softer consumer backdrop and weaker international sales. The key questions are how comfortable you are with those headwinds and whether the analyst P/E assumption of 20.1x in 2029 fits your view.
Fair value: US$45.33 per share
Implied pricing gap vs last close: about 32.5% above this fair value
Revenue growth assumption: 2.2% a year
- The bearish cohort still assumes revenue and earnings improve from today, but pairs that with a lower future P/E of 11.4x and a fair value that sits toward the bottom of the analyst target range.
- This view leans heavily on tariff exposure, higher costs tied to electrification, changing customer habits and demographic trends, and the risk that promotions and competition keep margins under pressure.
- It also recognises that product launches, supply chain work and a solid balance sheet could support the business over time, yet argues the current share price already reflects more optimism than these analysts are comfortable with.
Both narratives use the same company and the same broad data set, but apply different convictions about how the next few years play out. That is exactly the kind of tension you may want to explore before forming your own view on Polaris. You can stress test your own assumptions against these and build a version that reflects your expectations for earnings, tariffs, demand and valuation multiples, then compare that outcome with where the shares trade today using Narratives on Simply Wall St.
Do you think there's more to the story for Polaris? Head over to our Community to see what others are saying!

This article by Simply Wall St is general in nature. We provide commentary based on historical data and analyst forecasts only using an unbiased methodology and our articles are not intended to be financial advice. It does not constitute a recommendation to buy or sell any stock, and does not take account of your objectives, or your financial situation. We aim to bring you long-term focused analysis driven by fundamental data. Note that our analysis may not factor in the latest price-sensitive company announcements or qualitative material. Simply Wall St has no position in any stocks mentioned.