Is Procter & Gamble (PG) Offering Value After Recent Share Price Weakness
Procter & Gamble Company PG | 143.12 | -0.67% |
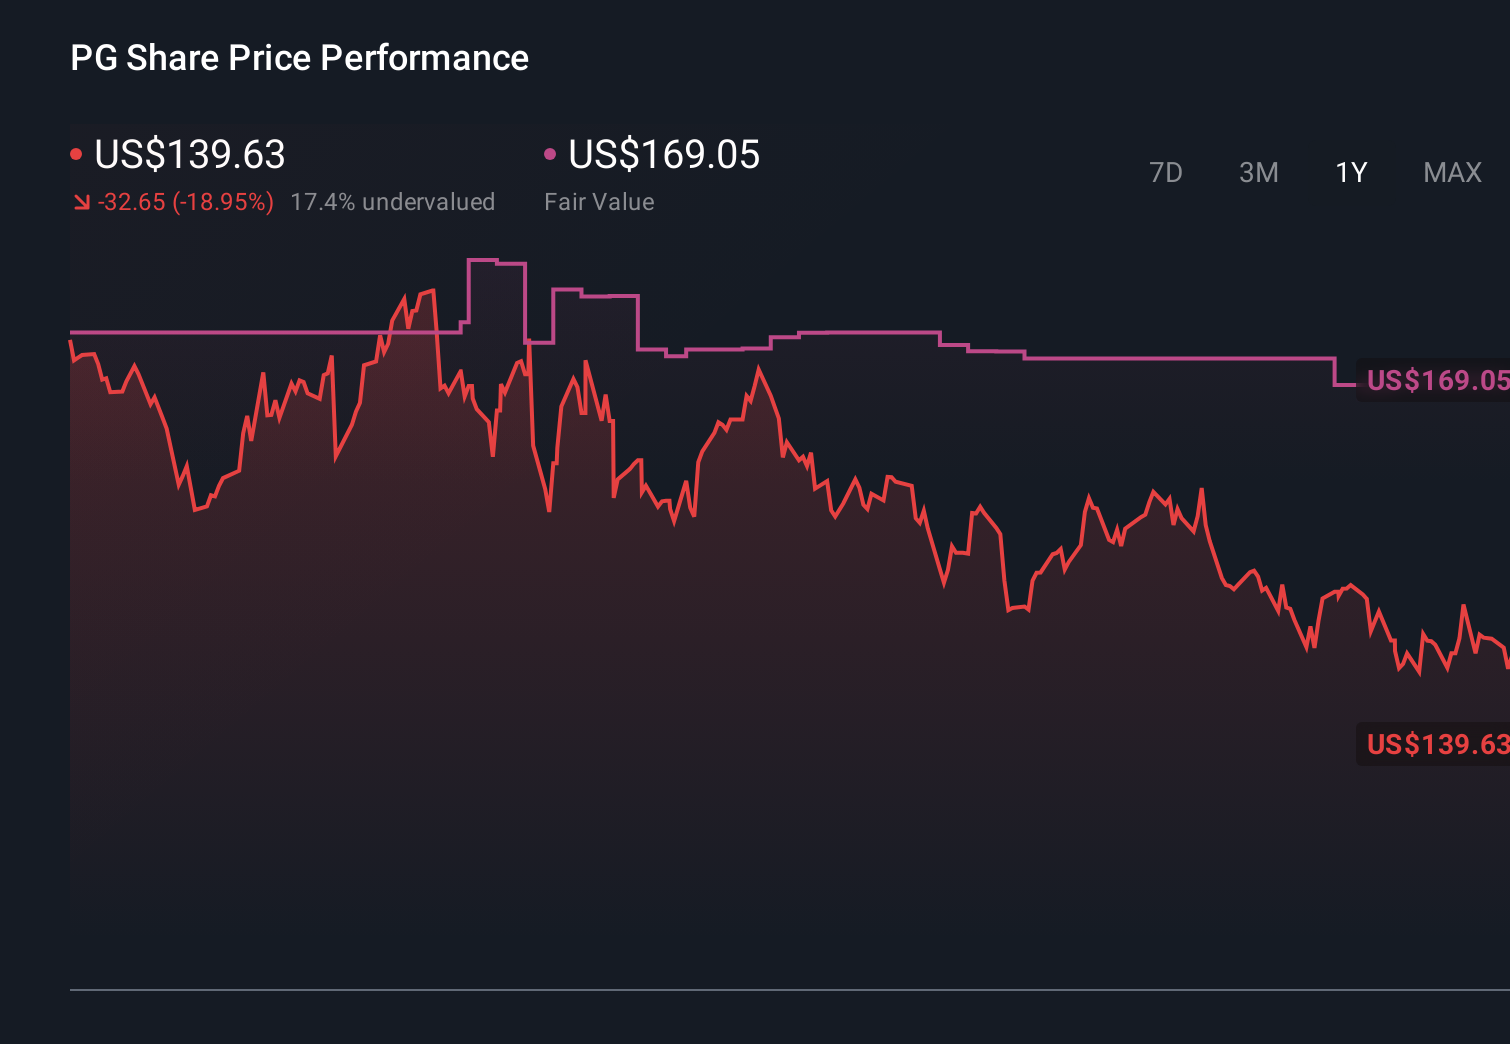
- If you are wondering whether Procter & Gamble is fairly priced or offering value right now, it helps to start with how the market has been treating the stock recently.
- The share price closed at US$144.53, with returns of 1.9% over the last 7 days, a 2.2% decline over 30 days, 1.9% year to date, and a 7.9% decline over 1 year. The 3 year and 5 year returns sit at 8.4% and 25.2% respectively.
- These mixed returns can reflect shifting views on consumer staples and how investors are weighing stability against other opportunities. In that context, it can be especially useful to focus on what you are paying for Procter & Gamble's cash flows and earnings rather than just the recent share price path.
- On our checks the stock scores 4 out of 6 for value. You can see that score in detail at 4/6 valuation checks. That sets up a closer look at different valuation methods and, later in the article, a more complete way to think about what the current price really offers you.
Approach 1: Procter & Gamble Discounted Cash Flow (DCF) Analysis
A Discounted Cash Flow, or DCF, model estimates what a company might be worth by projecting its future cash flows and then discounting those cash flows back to today’s value.
For Procter & Gamble, the latest twelve month Free Cash Flow is about $15.4b. Using a 2 Stage Free Cash Flow to Equity model that relies on analyst estimates in the early years and Simply Wall St extrapolations after that, projected Free Cash Flow reaches about $22.5b in 2035. Each future cash flow is discounted back to today using a required return so that future dollars are put on the same footing as current dollars.
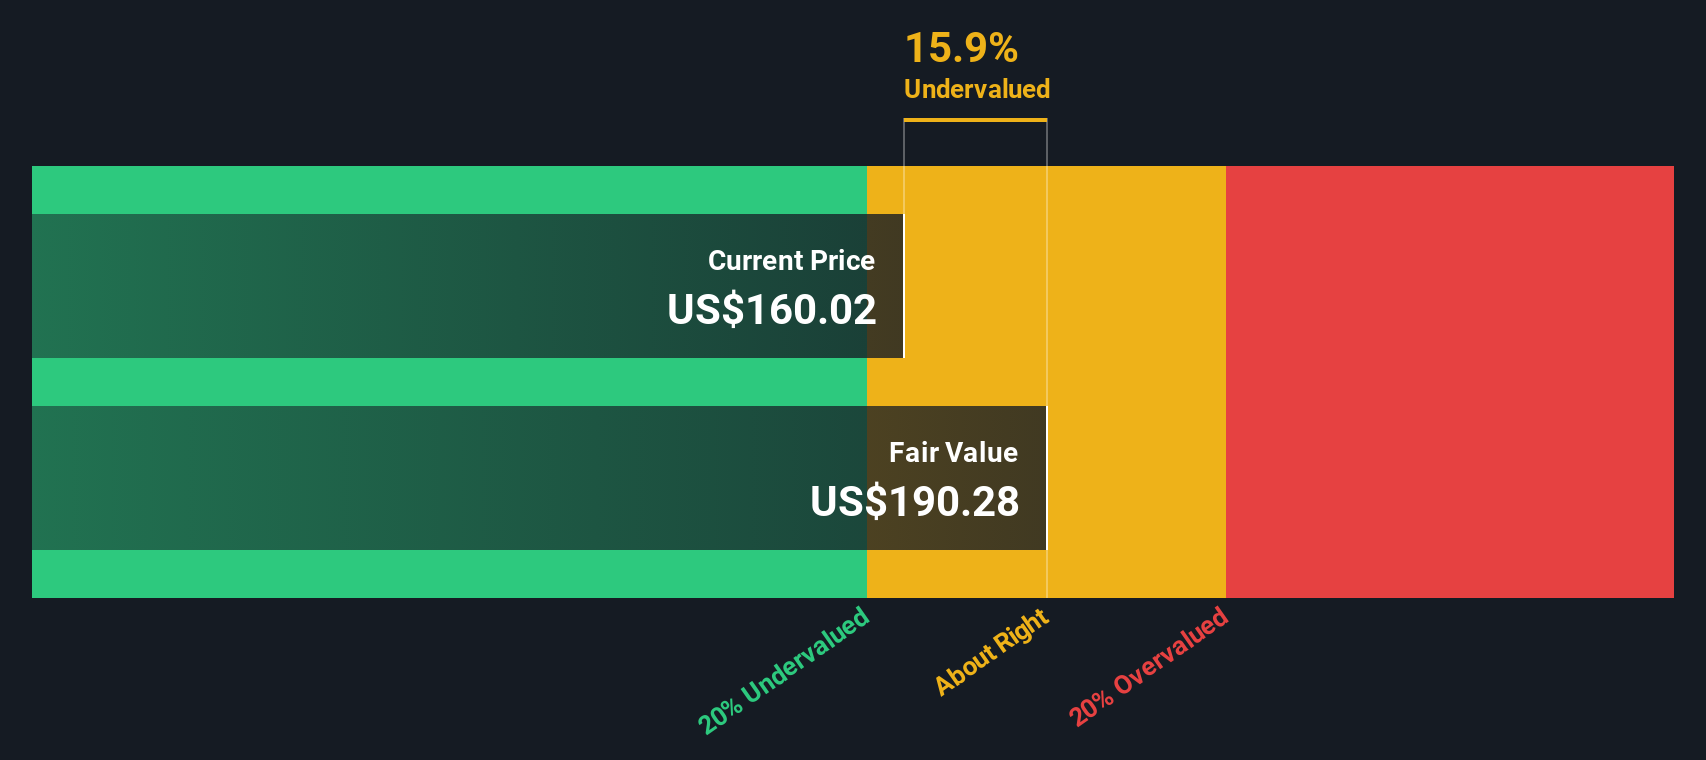
On this basis, the model arrives at an estimated intrinsic value of about $193.88 per share. Compared with the recent share price of $144.53, the DCF output suggests the shares trade at a 25.5% discount to this intrinsic value. This indicates that, on this cash flow view, the stock appears undervalued.
Result: UNDERVALUED
Our Discounted Cash Flow (DCF) analysis suggests Procter & Gamble is undervalued by 25.5%. Track this in your watchlist or portfolio, or discover 863 more undervalued stocks based on cash flows.
Approach 2: Procter & Gamble Price vs Earnings
For a mature, profitable company like Procter & Gamble, the P/E ratio is a useful yardstick because it directly links what you pay today to the earnings the business is already generating. You are essentially asking how many dollars you are paying for each dollar of current earnings.
What counts as a “normal” P/E depends on how quickly earnings are expected to grow and how risky those earnings appear. Higher expected growth or lower perceived risk can justify a higher multiple, while slower growth or higher uncertainty usually points to a lower one.
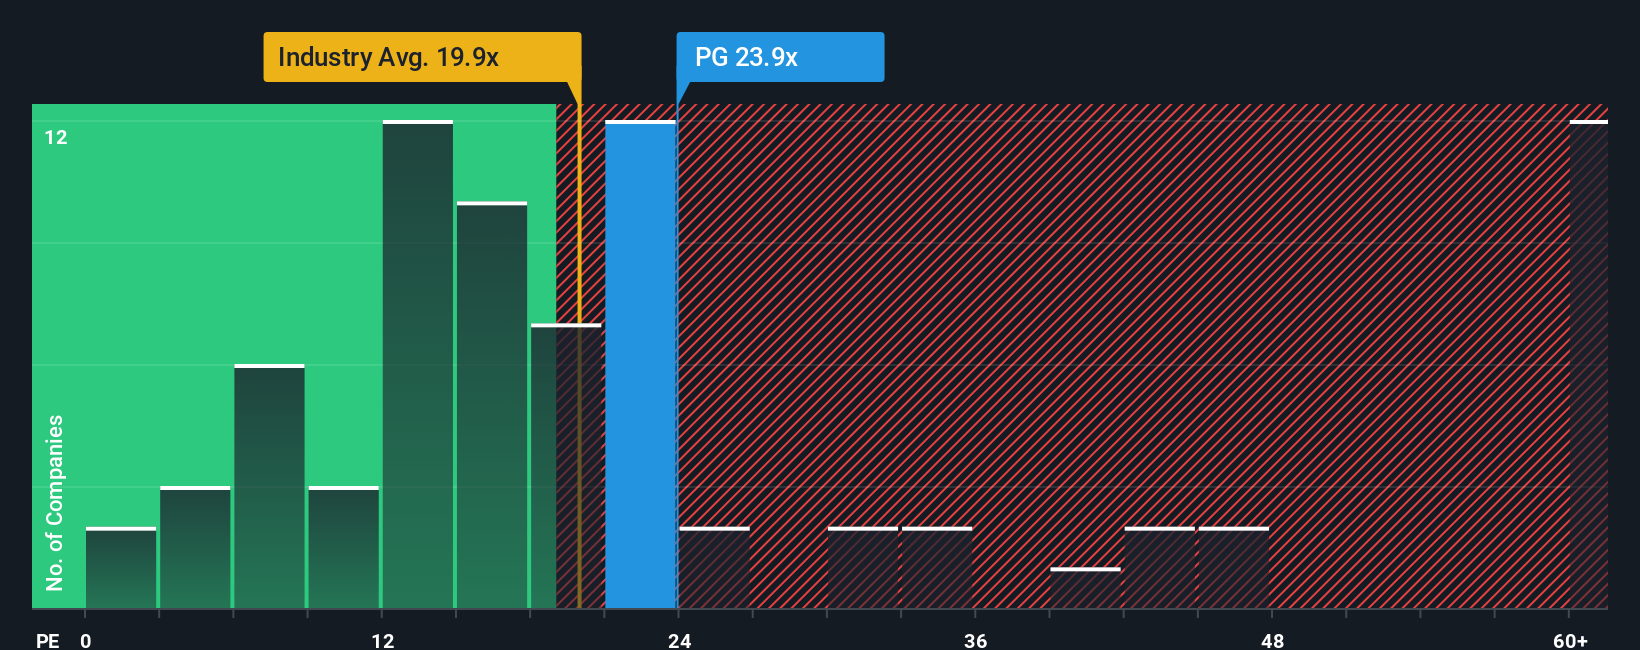
Procter & Gamble currently trades on a P/E of 20.50x. That sits slightly below the peer average of 21.23x and above the Household Products industry average of 16.94x. Simply Wall St’s Fair Ratio for Procter & Gamble is 21.02x. This is its proprietary view of what the P/E could be given factors like earnings growth, profit margins, industry, market cap and risk profile. This tailored Fair Ratio is often more informative than a simple peer or industry comparison because it adjusts for company specific traits instead of assuming all businesses deserve the same multiple. With the actual P/E of 20.50x only modestly below the Fair Ratio of 21.02x, the shares look about in line with this earnings based yardstick.
Result: ABOUT RIGHT
P/E ratios tell one story, but what if the real opportunity lies elsewhere? Discover 1445 companies where insiders are betting big on explosive growth.
Upgrade Your Decision Making: Choose your Procter & Gamble Narrative
Earlier we mentioned that there is an even better way to understand valuation. On Simply Wall St this comes through Narratives, which let you attach a clear story about Procter & Gamble to the numbers you care about by connecting your view of future revenue, earnings and margins to a forecast, then to a fair value, and finally to a simple comparison between that fair value and today’s price on the Community page used by millions of investors.
Instead of relying only on a DCF output or a P/E multiple, you can pick or build a Narrative that matches how you see the business. The platform will then translate that story into a full financial model that updates automatically when new information such as earnings or news is added, so your fair value view does not stay static.
For example, one Procter & Gamble Narrative on the Community page currently anchors on a fair value near US$119.81, while another sits around US$168.13. This shows how two investors can look at the same company, plug in different revenue growth, margin and discount rate assumptions, and reach very different but clearly explained conclusions about whether the current price looks attractive or not to them.
For Procter & Gamble, however, we will make it really easy for you with previews of two leading Procter & Gamble narratives:
Fair value in this narrative: about US$168.13 per share
Implied discount to this fair value versus the recent US$144.53 price: about 14.0% undervalued based on ((168.13 - 144.53) / 168.13)
Revenue growth assumption: about 3.12% a year
- Analysts in this narrative link Procter & Gamble’s product investment and category expansion to expected revenue growth and slightly higher profit margins over the next few years.
- They factor in ongoing cash returns to shareholders through dividends and share repurchases, with modest share count reduction helping earnings per share.
- Risks such as market volatility in key regions, tariffs, currency moves and slower growth in focus markets are recognised as potential challenges to those earnings and margin assumptions.
Fair value in this narrative: about US$119.81 per share
Implied premium to this fair value versus the recent US$144.53 price: about 20.6% overvalued based on ((144.53 - 119.81) / 119.81)
Revenue growth assumption: about 4.68% a year
- This narrative values Procter & Gamble using a blend of DCF, dividend discount, historical dividend yield and historical P/E, with more weight on the cash flow and dividend models.
- It assumes modest revenue and free cash flow growth in the low single digits, solid but slightly lower margins over time, and a continued focus on dividends supported by strong returns on invested capital.
- On those inputs, the blended fair value comes out well below the recent share price, so the author views the stock as high quality but priced at a premium unless revenue or margin outcomes are stronger than these assumptions.
Do you think there's more to the story for Procter & Gamble? Head over to our Community to see what others are saying!
This article by Simply Wall St is general in nature. We provide commentary based on historical data and analyst forecasts only using an unbiased methodology and our articles are not intended to be financial advice. It does not constitute a recommendation to buy or sell any stock, and does not take account of your objectives, or your financial situation. We aim to bring you long-term focused analysis driven by fundamental data. Note that our analysis may not factor in the latest price-sensitive company announcements or qualitative material. Simply Wall St has no position in any stocks mentioned.