Is QuantumScape (QS) Share Price Out Of Sync With Its Long Term Potential?
QuantumScape QS | 6.36 | +2.42% |
- If you are wondering whether QuantumScape's current share price lines up with its long term promise, this article will walk you through how the numbers stack up.
- The stock closed at US$8.47 recently, with a 4.3% decline over 7 days, a 20.2% decline over 30 days, a 23.4% decline year to date, a 71.5% gain over the past year, a 3.2% gain over 3 years, and an 84.5% decline over 5 years.
- Recent attention on QuantumScape has been driven less by short term events like earnings and more by its position in the electric vehicle battery space and the long duration nature of its technology roadmap. That mix of long term potential and a share price that has moved sharply over different time frames is leading many investors to reassess what they are willing to pay today.
- On our checks, QuantumScape scores 2 out of 6 for being undervalued. Next we look at what traditional valuation methods say about that score, before finishing with a different way of thinking about valuation that some investors may find more useful.
QuantumScape scores just 2/6 on our valuation checks. See what other red flags we found in the full valuation breakdown.
Approach 1: QuantumScape Discounted Cash Flow (DCF) Analysis
A Discounted Cash Flow, or DCF, model takes projected future cash flows and discounts them back to today to estimate what the business might be worth right now.
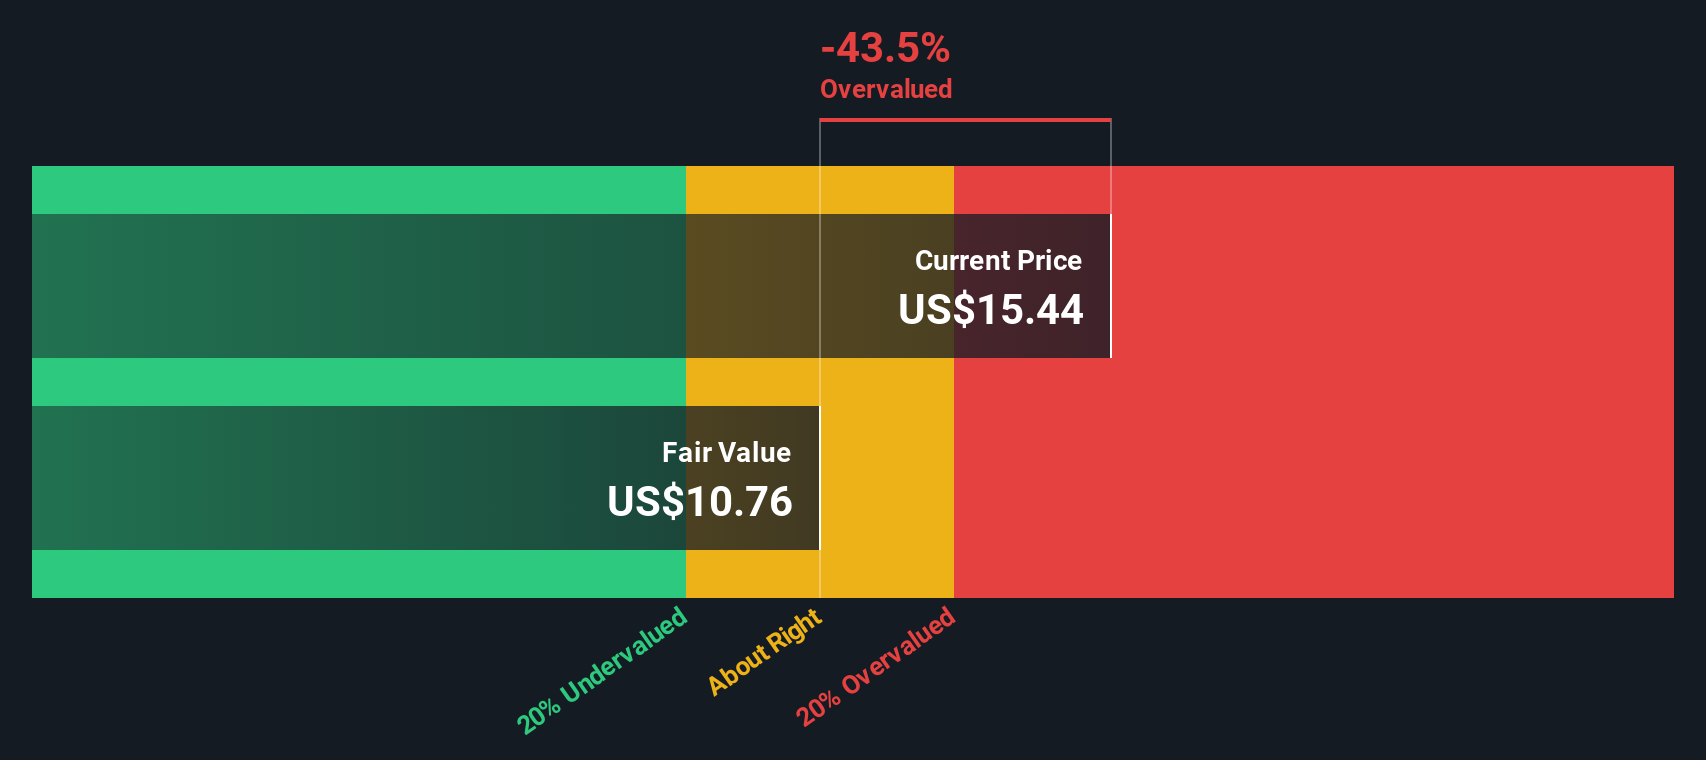
For QuantumScape, the latest twelve month free cash flow (FCF) is a loss of $280.027 million. Analysts provide explicit FCF estimates up to 2030, and Simply Wall St extrapolates further years from there. On this view, FCF is projected to reach $533 million by 2030, with intermediate years moving from losses in 2026 to 2028 to positive FCF from 2029 onward. All figures here are in US$.
Using a 2 Stage Free Cash Flow to Equity model, these cash flows are discounted back and combined to give an estimated intrinsic value of about $53.26 per share. Compared with the recent share price of $8.47, this suggests the stock is 84.1% undervalued on this model.
Result: UNDERVALUED
Our Discounted Cash Flow (DCF) analysis suggests QuantumScape is undervalued by 84.1%. Track this in your watchlist or portfolio, or discover 52 more high quality undervalued stocks.
Approach 2: QuantumScape Price vs Book
For companies that are not yet profitable or have volatile earnings, a P/B ratio is often more useful than P/E, because it compares the share price to the accounting value of net assets rather than to earnings that may be negative or inconsistent.
In general, investors tend to accept a higher P/B ratio when they expect stronger growth and lower risk, and a lower P/B ratio when growth prospects are modest or risks are higher. What looks like a "normal" or "fair" P/B is really a reflection of what the market thinks about those two ingredients.
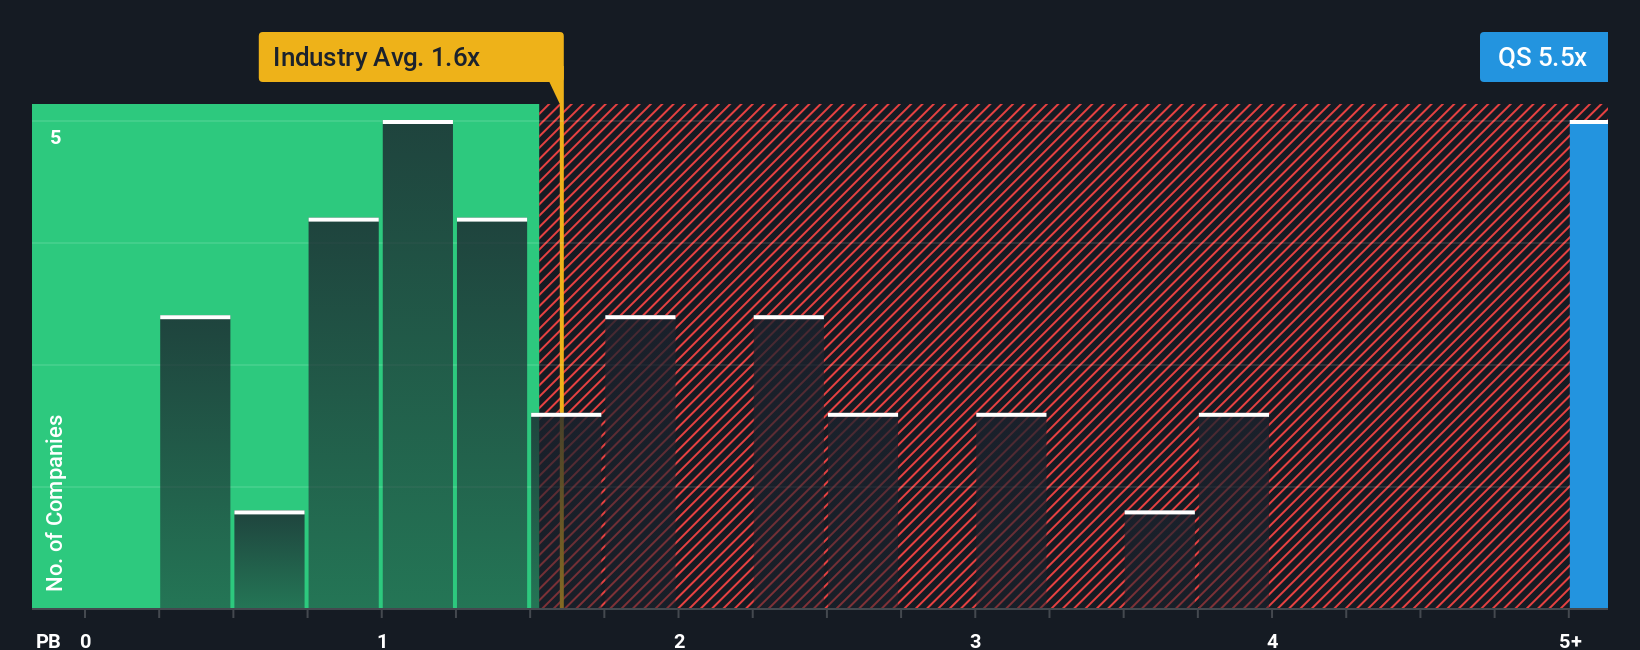
QuantumScape currently trades on a P/B of 4.19x. That sits above the Auto Components industry average of 1.69x and the peer group average of 1.84x. Simply Wall St’s Fair Ratio framework goes a step further by estimating what P/B might be reasonable after weighing factors such as expected earnings growth, profit margins, the company’s size, its industry and specific risk profile, rather than just lining it up against broad averages. Comparing QuantumScape’s actual 4.19x P/B with this Fair Ratio indicates the stock is OVERVALUED on this metric.
Result: OVERVALUED
P/B ratios tell one story, but what if the real opportunity lies elsewhere? Start investing in legacies, not executives. Discover our 22 top founder-led companies.
Upgrade Your Decision Making: Choose your QuantumScape Narrative
Earlier we mentioned that there is an even better way to understand valuation, so let us introduce you to Narratives, which let you attach a clear story, your view on QuantumScape’s technology, execution and risks, to the numbers such as your fair value, revenue, earnings and margin assumptions.
A Narrative connects three pieces in one place: the company’s story, a financial forecast built from your expectations, and the fair value that falls out of those assumptions, so you can see exactly why your number is different from the current share price.
On Simply Wall St’s Community page, used by millions of investors, Narratives are an easy tool you can use to compare your view of QuantumScape’s fair value to its latest market price and decide whether that gap is large enough to consider buying, holding, or selling.
Because Narratives update automatically when new information like news, filings or earnings is added to the platform, your fair value stays aligned with what is actually happening. This means two investors can reasonably hold very different Narratives for QuantumScape, one assuming a much higher fair value based on strong adoption of solid state batteries and one assuming a much lower fair value if commercialization is slower or more costly than they expect.
Do you think there's more to the story for QuantumScape? Head over to our Community to see what others are saying!

This article by Simply Wall St is general in nature. We provide commentary based on historical data and analyst forecasts only using an unbiased methodology and our articles are not intended to be financial advice. It does not constitute a recommendation to buy or sell any stock, and does not take account of your objectives, or your financial situation. We aim to bring you long-term focused analysis driven by fundamental data. Note that our analysis may not factor in the latest price-sensitive company announcements or qualitative material. Simply Wall St has no position in any stocks mentioned.