Is Redwire (RDW) Pricing Reflect Long Term Value After Space Infrastructure Interest?
Redwire Corp RDW | 0.00 |
- If you are wondering whether Redwire's share price still reflects its true worth after recent moves, you are not alone.
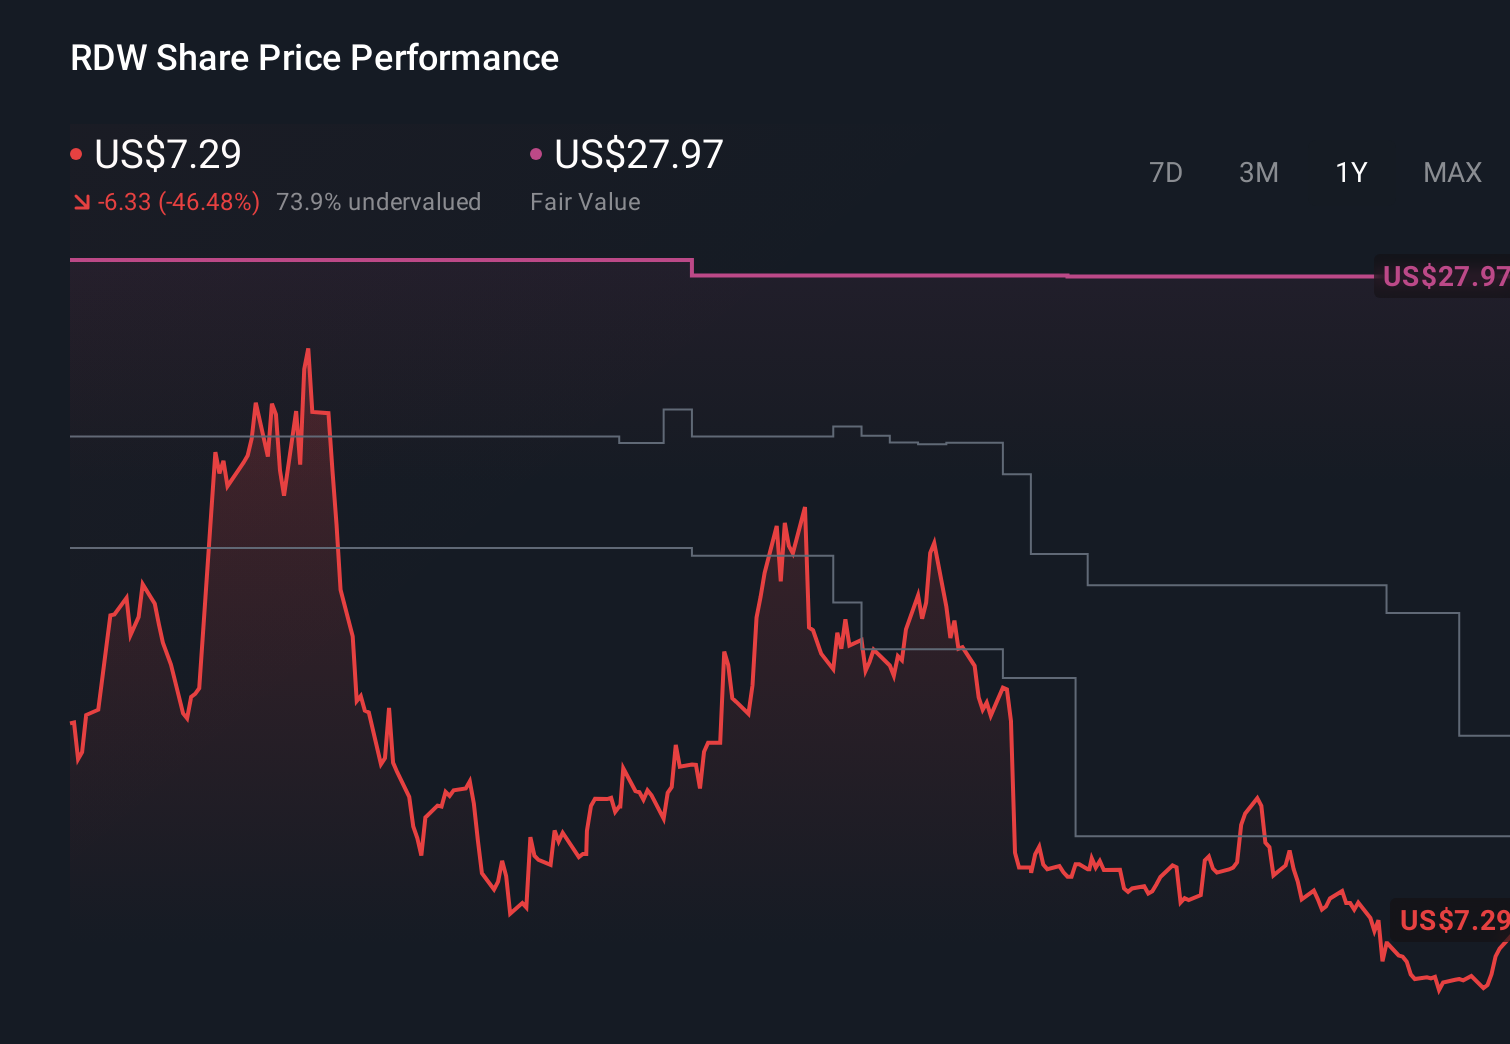
- The stock most recently closed at US$12.52, with returns of 6.9% over 7 days, 75.1% over 30 days, 38.6% year to date and a 41.1% decline over 1 year, alongside a very large 3 year return and a 19.2% return over 5 years.
- Recent news flow around Redwire has included ongoing interest in its space infrastructure capabilities and its role as a contractor in the US space sector. This has helped keep the stock on the radar of growth focused investors. These developments give context to the sharp swings in the share price and help explain why sentiment around the company can change quickly.
- Despite that backdrop, Redwire currently has a valuation score of 0/6. We will look at what this means through different valuation approaches and then finish with a way of thinking about value that can be even more useful than the numbers alone.
Redwire scores just 0/6 on our valuation checks. See what other red flags we found in the full valuation breakdown.
Approach 1: Redwire Discounted Cash Flow (DCF) Analysis
A Discounted Cash Flow model takes estimates of a company’s future cash flows and discounts them back to today’s dollars, aiming to translate those future amounts into a single present value per share.
For Redwire, the model used is a 2 Stage Free Cash Flow to Equity approach, with all cash flows in US$. The latest twelve month free cash flow is a loss of $159.37 million. Analysts provide free cash flow estimates out to 2027, and Simply Wall St extrapolates further to build a 10 year path. By 2035, the model projects free cash flow of $17.79 million, with intermediate annual figures such as $26.40 million in 2026 and $21.83 million in 2027.
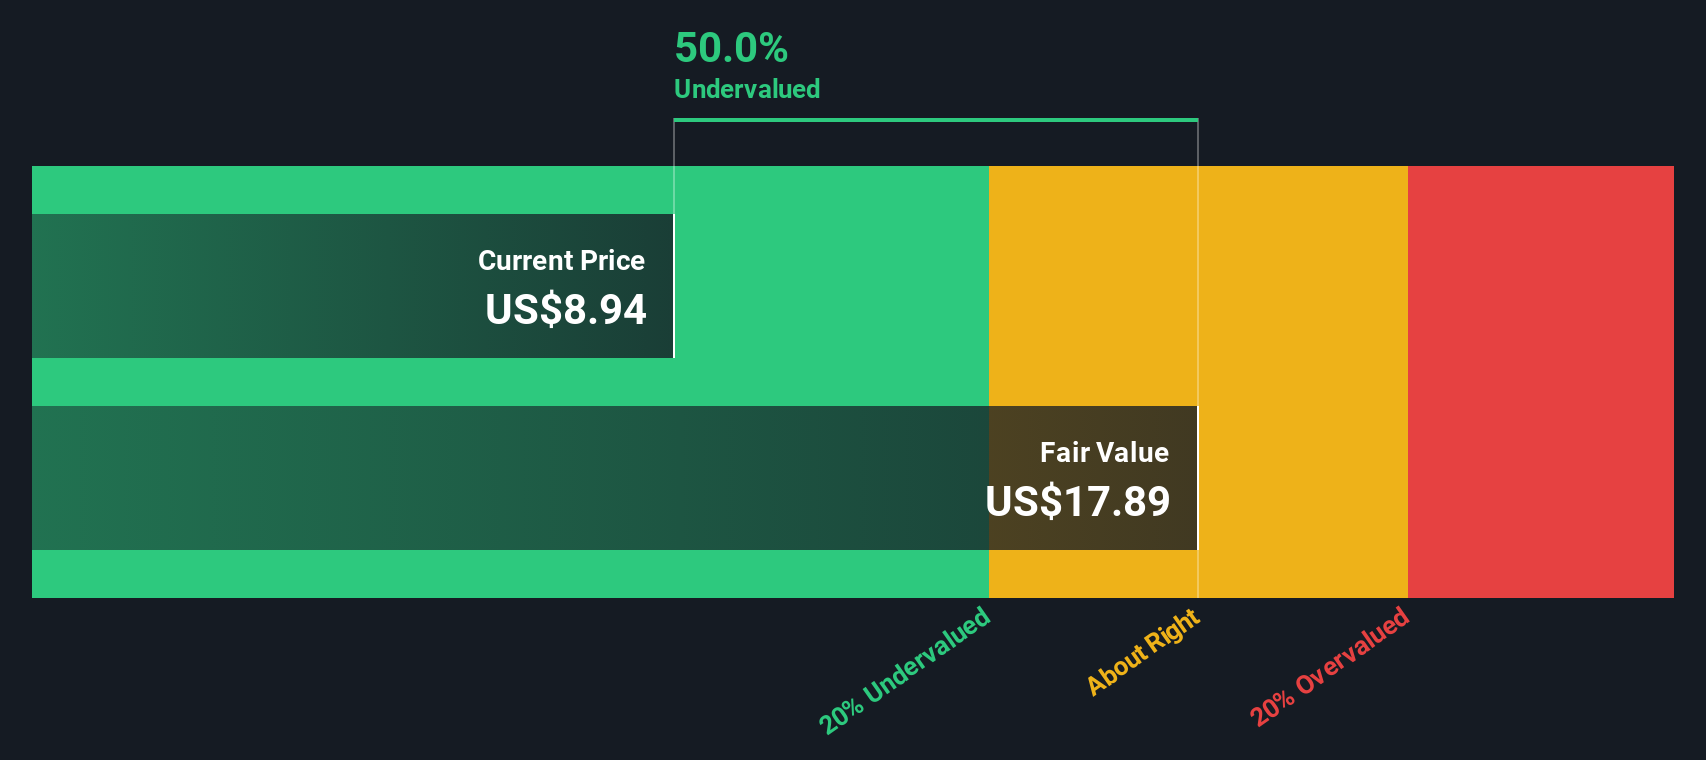
When these projected cash flows are discounted back, the DCF output suggests an estimated intrinsic value of about $1.98 per share. Compared to a recent share price of US$12.52, the model implies Redwire is very expensive on this cash flow view, with an indicated overvaluation of roughly 532.7%.
Result: OVERVALUED
Our Discounted Cash Flow (DCF) analysis suggests Redwire may be overvalued by 532.7%. Discover 873 undervalued stocks or create your own screener to find better value opportunities.
Approach 2: Redwire Price vs Sales
For companies that are not yet generating consistent profits, P/S is often more useful than P/E because it compares the value the market places on the business to its revenue rather than its earnings. Investors usually accept a higher or lower P/S depending on what they expect for future growth and how risky they think those sales are.
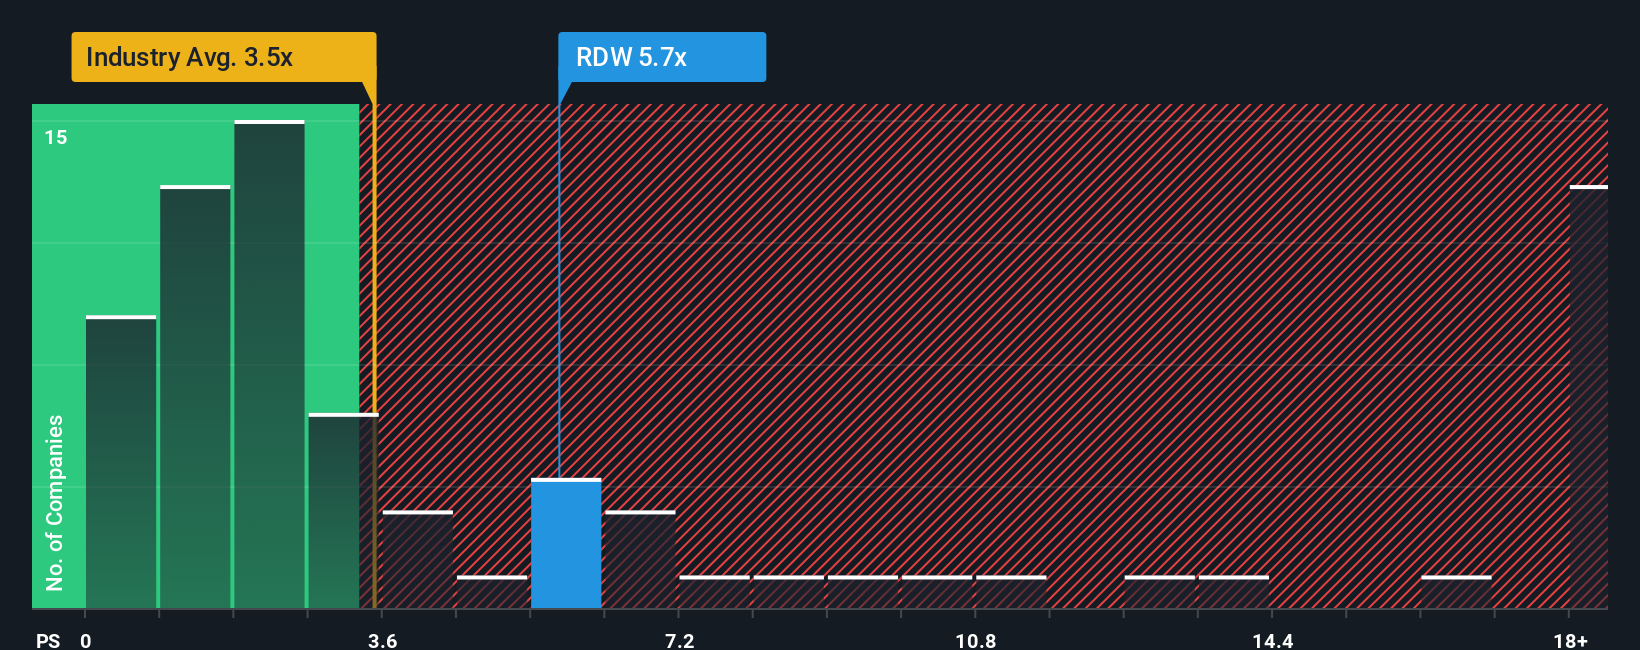
Redwire currently trades on a P/S of 6.98x. That sits above the Aerospace & Defense industry average of 3.80x and also above the peer average of 2.18x, so the stock carries a higher sales multiple than these broad benchmarks.
Simply Wall St’s Fair Ratio is an estimate of what P/S might make sense for Redwire given factors such as its growth profile, profit margins, industry, market cap and company specific risks. Because it blends all of these into one figure, it can be more tailored than a simple comparison with peers or the sector, which do not adjust for company level differences.
For Redwire, the Fair Ratio is 2.05x, which is well below the current 6.98x P/S. On this measure, the shares look expensive relative to the sales multiple implied by the Fair Ratio.
Result: OVERVALUED
P/S ratios tell one story, but what if the real opportunity lies elsewhere? Discover 1429 companies where insiders are betting big on explosive growth.
Upgrade Your Decision Making: Choose your Redwire Narrative
Earlier we mentioned that there is an even better way to understand valuation, so let us introduce you to Narratives, which are simply your story about a company linked directly to your assumptions for fair value, future revenue, earnings and margins.
Instead of only looking at preset models, you spell out what you think Redwire’s business story looks like, connect that story to a financial forecast, and the Narrative then translates those inputs into a fair value that you can compare with today’s share price.
Narratives on Simply Wall St, which are available to you in the Community page used by millions of investors, are quick to set up, easy to adjust and automatically update when new information such as news or earnings is added.
That means you can review whether you want to buy, hold or sell by checking how your Narrative fair value compares with the current market price. You can also see how other investors differ. For example, one Redwire Narrative might set a very low fair value with cautious revenue growth and modest margins, while another might set a much higher fair value with stronger revenue assumptions and improved profitability.
Do you think there's more to the story for Redwire? Head over to our Community to see what others are saying!
This article by Simply Wall St is general in nature. We provide commentary based on historical data and analyst forecasts only using an unbiased methodology and our articles are not intended to be financial advice. It does not constitute a recommendation to buy or sell any stock, and does not take account of your objectives, or your financial situation. We aim to bring you long-term focused analysis driven by fundamental data. Note that our analysis may not factor in the latest price-sensitive company announcements or qualitative material. Simply Wall St has no position in any stocks mentioned.