Is Reinsurance Group of America (RGA) Pricing Look Attractive After Recent Share Price Weakness
Reinsurance Group of America, Incorporated RGA | 208.73 | +0.47% |
- If you are wondering whether Reinsurance Group of America (RGA) is priced attractively right now, the key question is how its current share price compares with its underlying value.
- The stock last closed at US$194.33, with a 1.8% decline over the past week, a 5.5% decline over the past month, a 4.5% decline year to date, and a 42.1% return over three years and 100.3% over five years.
- Recent price moves come against a backdrop of ongoing sector-wide focus on life and health reinsurance, where investors often weigh balance sheet resilience and long-term policy obligations. Broader conversations around interest rates and insurance capital requirements also tend to influence how a reinsurer like RGA is priced.
- On our valuation checks, Reinsurance Group of America scores 4 out of 6. You can see the breakdown in this valuation score, which we will unpack using standard models before finishing with a more holistic way to think about RGA's value.
Approach 1: Reinsurance Group of America Excess Returns Analysis
The Excess Returns model looks at how much value Reinsurance Group of America creates over and above the return that shareholders are assumed to require. Instead of focusing on cash flows, it starts with the balance sheet and earnings power, then asks whether the return on equity comfortably exceeds the cost of equity.
For RGA, the model uses a Book Value of $197.51 per share and a Stable EPS of $33.49 per share, based on weighted future Return on Equity estimates from 6 analysts. The Average Return on Equity is 13.89%. Against this, the Cost of Equity is set at $17.06 per share, which leads to an Excess Return of $16.42 per share. The Stable Book Value input is $241.06 per share, sourced from weighted future Book Value estimates from 7 analysts.
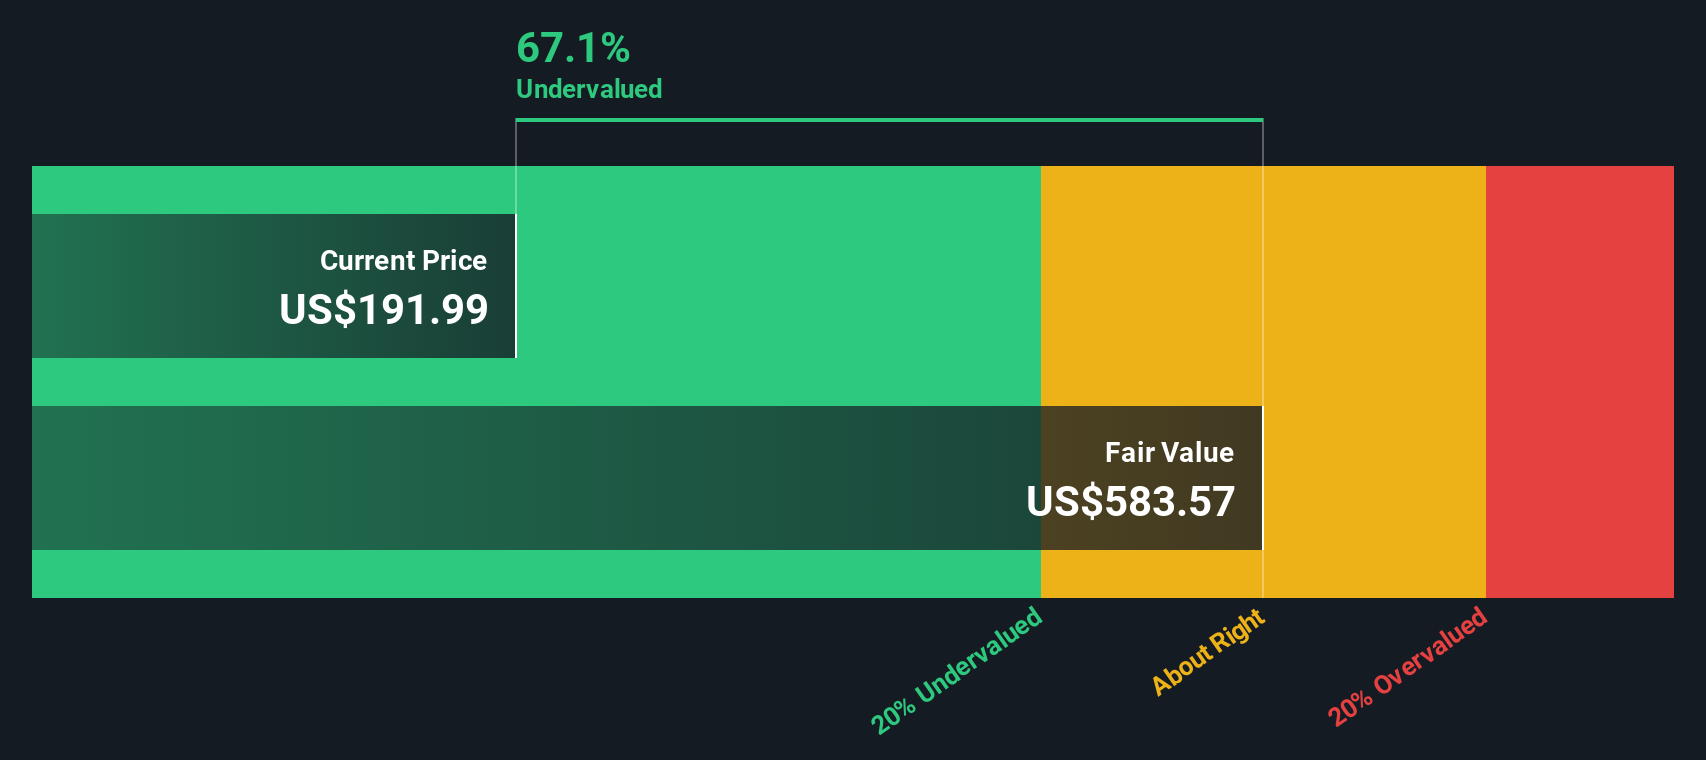
Bringing these inputs together, the Excess Returns model arrives at an intrinsic value estimate of about $671.09 per share. Compared with the recent share price of US$194.33, this implies the stock is 71.0% undervalued on this framework.
Result: UNDERVALUED
Our Excess Returns analysis suggests Reinsurance Group of America is undervalued by 71.0%. Track this in your watchlist or portfolio, or discover 872 more undervalued stocks based on cash flows.
Approach 2: Reinsurance Group of America Price vs Earnings
For a profitable business like Reinsurance Group of America, the P/E ratio is a useful yardstick because it compares what you pay per share with the earnings that each share generates. It ties the share price directly to the company’s current earning power, which is what many investors ultimately focus on.
What counts as a “normal” P/E depends on how the market views a company’s growth prospects and risks. Higher expected earnings growth or lower perceived risk often support a higher P/E, while slower expected growth or higher risk usually point to a lower, more cautious multiple.
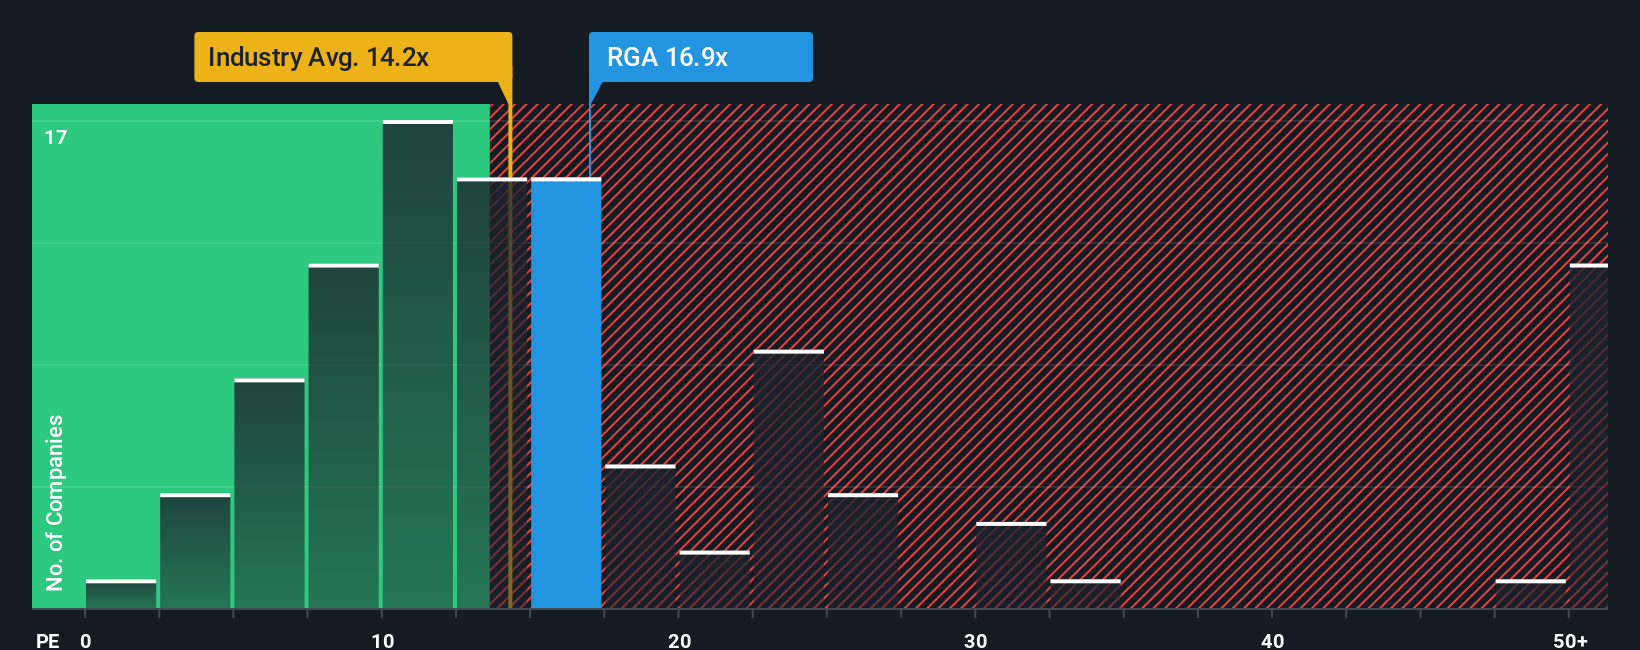
RGA currently trades on a P/E of 14.73x. That sits above the Insurance industry average P/E of 12.59x and is close to the peer average of 14.29x. Simply Wall St’s Fair Ratio for RGA is 17.90x, which aims to estimate a more tailored P/E based on factors such as earnings growth, profit margins, industry, market cap and company specific risks. This Fair Ratio can be more informative than a simple peer or industry comparison because it adjusts for the company’s own characteristics rather than relying on broad group averages.
Comparing RGA’s current P/E of 14.73x with the Fair Ratio of 17.90x suggests the shares trade below this modelled “fair” level.
Result: UNDERVALUED
P/E ratios tell one story, but what if the real opportunity lies elsewhere? Discover 1446 companies where insiders are betting big on explosive growth.
Upgrade Your Decision Making: Choose your Reinsurance Group of America Narrative
Earlier we mentioned that there is an even better way to understand valuation, so let us introduce you to Narratives, which are simple stories you create about a company like Reinsurance Group of America that link your view of its future revenue, earnings and margins to a financial forecast and then to a fair value. On Simply Wall St’s Community page, used by millions of investors, you can set up a Narrative by plugging in your assumptions, see the fair value that drops out and then compare it directly with the current share price to help you decide whether you think the stock looks attractive or expensive at that moment. Narratives are easy to adjust and they update when new information such as earnings or major news is added, so your story and numbers stay aligned without much effort. For example, one Reinsurance Group of America Narrative on the Community page might assume very cautious growth and arrive at a fair value close to today’s price, while another more optimistic Narrative could pencil in stronger future profitability and produce a materially higher fair value.
Do you think there's more to the story for Reinsurance Group of America? Head over to our Community to see what others are saying!

This article by Simply Wall St is general in nature. We provide commentary based on historical data and analyst forecasts only using an unbiased methodology and our articles are not intended to be financial advice. It does not constitute a recommendation to buy or sell any stock, and does not take account of your objectives, or your financial situation. We aim to bring you long-term focused analysis driven by fundamental data. Note that our analysis may not factor in the latest price-sensitive company announcements or qualitative material. Simply Wall St has no position in any stocks mentioned.