Is Rivian (RIVN) Now An Opportunity After Recent Stock Volatility?
Rivian Automotive RIVN | 0.00 |
- Wondering if Rivian Automotive at US$14.60 is an opportunity or a value trap? This article breaks down what the current price really implies.
- The stock has been volatile, with returns of a 9.5% decline over 7 days, a 5.2% decline over 30 days and a 24.8% decline year to date. It also shows an 8.1% return over 1 year and 5.3% over 3 years.
- Recent headlines around Rivian continue to focus on its position in the electric vehicle space and how the market views its long term potential. This can quickly sway sentiment and trading volumes. These shifts in attention often help explain sharp short term price moves, even without major changes to fundamentals.
- Rivian currently scores a 2 out of 6 valuation check. The next sections will walk through what different valuation methods say about that price and then finish with a framework that can help you judge whether those methods line up with your own view of the stock.
Rivian Automotive scores just 2/6 on our valuation checks. See what other red flags we found in the full valuation breakdown.
Approach 1: Rivian Automotive Discounted Cash Flow (DCF) Analysis
A Discounted Cash Flow model estimates what a stock could be worth by projecting its future cash flows and then discounting those back to today to get a single present value per share.
For Rivian Automotive, the model used is a 2 Stage Free Cash Flow to Equity approach. The latest twelve months show free cash flow of about $2.7b outflow. Analyst and extrapolated projections in the model show free cash flows ranging from outflows in the near term to an inflow of $1.5b in 2030, all expressed in dollars and discounted back to today.
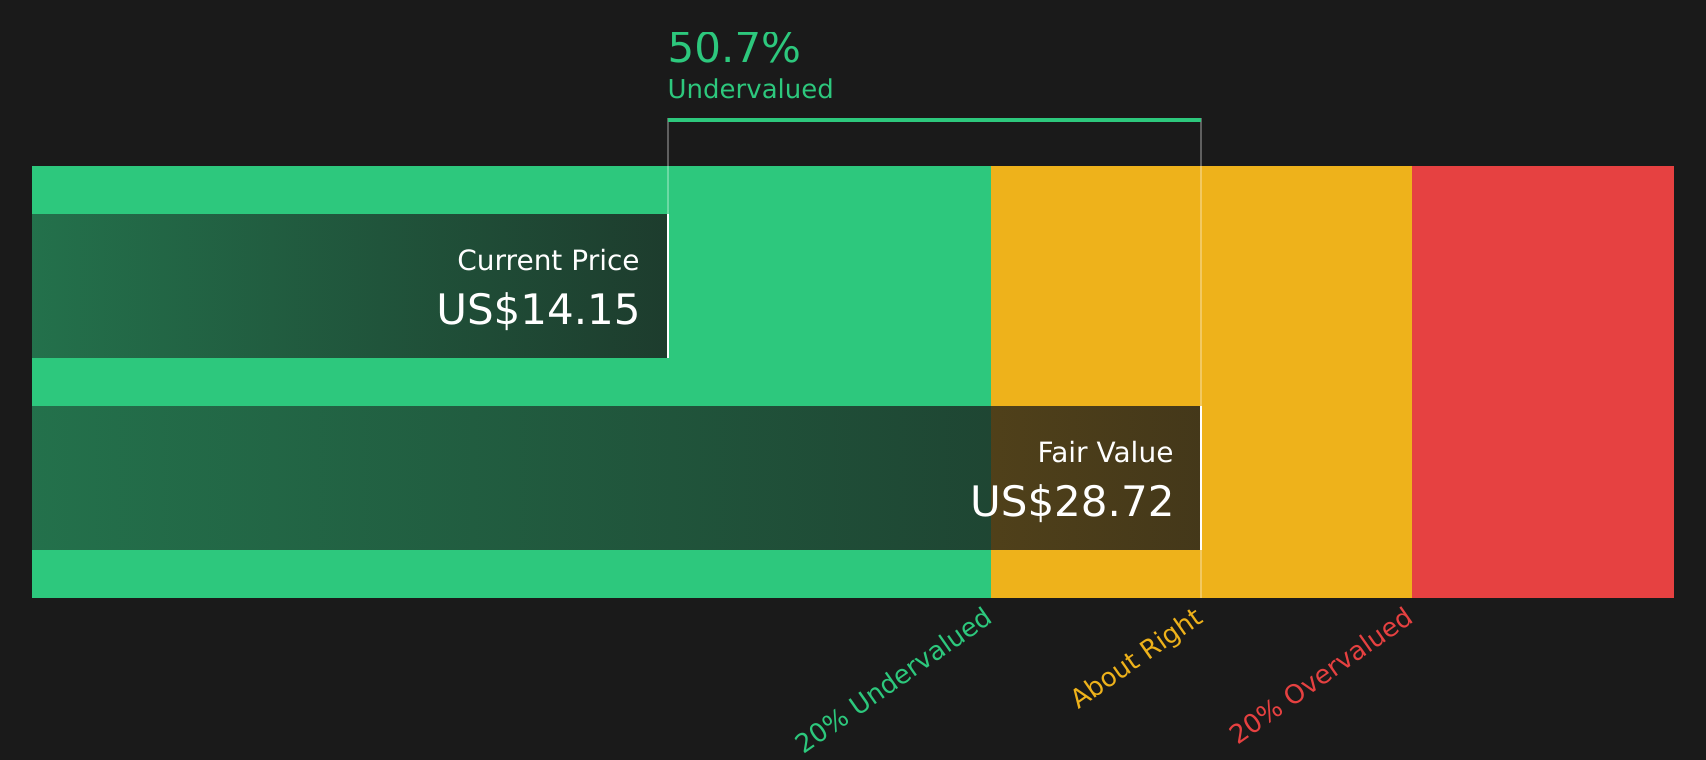
Bringing all those projected cash flows together, the DCF model produces an estimated fair value of US$29.27 per share. Compared with the current share price of US$14.60, this implies an intrinsic discount of about 50.1%, indicating that Rivian is trading at a substantial markdown relative to this cash flow based estimate.
Result: UNDERVALUED
Our Discounted Cash Flow (DCF) analysis suggests Rivian Automotive is undervalued by 50.1%. Track this in your watchlist or portfolio, or discover 51 more high quality undervalued stocks.
Approach 2: Rivian Automotive Price vs Sales
For companies where earnings are not yet positive, the P/S ratio is often more useful than P/E because it compares what you are paying to the revenue being generated, rather than profits that are still negative or volatile.
In general, higher expected growth and lower perceived risk can justify a higher P/S multiple, while slower expected growth and higher risk usually line up with a lower, more conservative range.
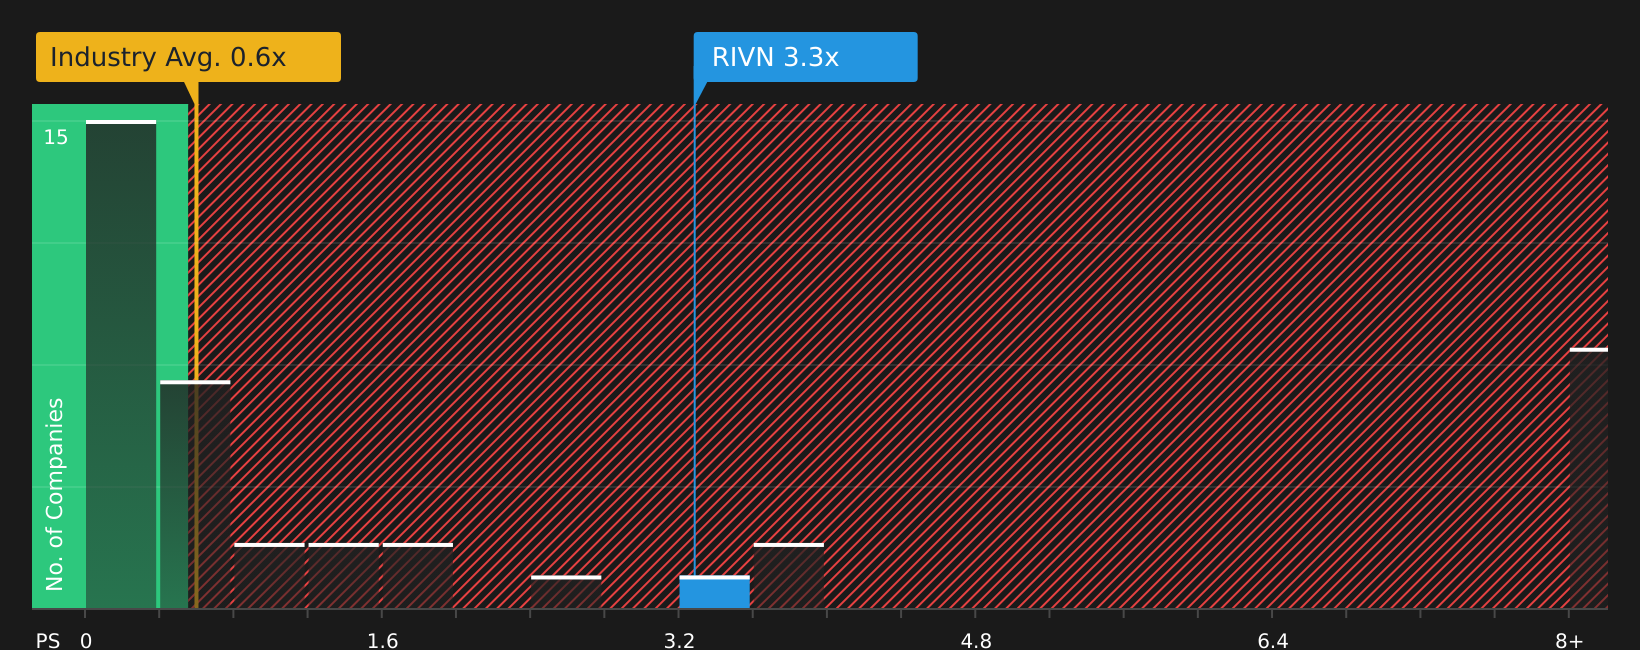
Rivian Automotive currently trades on a P/S of 3.38x. That is above both the Auto industry average of 0.85x and a peer average of 0.96x, which suggests the stock is priced at a premium to many listed competitors on this simple sales based yardstick.
Simply Wall St also calculates a proprietary “Fair Ratio” of 1.78x for Rivian. This is designed to reflect the P/S multiple that might be expected given factors such as earnings growth estimates, profit margins, industry, market cap and specific risk profile.
This Fair Ratio can be more informative than a basic peer or industry comparison because it adjusts for Rivian’s own characteristics instead of assuming all Auto stocks should trade on the same P/S.
Comparing the Fair Ratio of 1.78x with the current P/S of 3.38x, Rivian screens as trading above this model based level.
Result: OVERVALUED
P/S ratios tell one story, but what if the real opportunity lies elsewhere? Start investing in legacies, not executives. Discover our 19 top founder-led companies.
Upgrade Your Decision Making: Choose your Rivian Automotive Narrative
Earlier it was mentioned that there is an even better way to think about valuation, and on Simply Wall St that shows up as Narratives. These let you turn your view of Rivian’s story into a clear set of assumptions on future revenue, earnings and margins, link those assumptions to a Fair Value, and then keep that view updated in the Community page as new news or earnings arrive. This lets you quickly compare that Fair Value with the current price, whether you think Rivian is worth closer to US$25.00 or nearer to US$9.06, and decide for yourself how and when to act.
For Rivian Automotive, however, we will make it really easy for you with previews of two leading Rivian Automotive Narratives:
Start by asking which story feels closer to how you see the company, then use that as a reference point when you look at your own numbers and risk tolerance.
Fair value in this narrative: US$16.96 per share
Implied discount to this fair value versus the last close of US$14.60: about 13.9% undervalued
Revenue growth assumption: 40.76%
- Focuses on the R2 platform, manufacturing efficiency and partnerships such as the Volkswagen deal as key supports for future profitability and scale.
- Highlights vertical integration in autonomy, batteries and software, plus software and services revenue, as potential drivers of higher margins over time.
- Frames the current price as close to analyst fair value, with the consensus view that the stock is broadly fairly priced if those growth and margin assumptions play out.
Fair value in this narrative: US$9.06 per share
Implied premium to this fair value versus the last close of US$14.60: about 61.2% overvalued
Revenue growth assumption: 29.27%
- Emphasizes shrinking policy support, higher tariffs and weaker demand as pressures on margins, cash flow and the case for large capital spending plans.
- Points to high cash burn, ongoing losses and heavy investment needs as reasons the company may require additional funding over time.
- Uses a lower fair value anchored to the more cautious analyst targets, arguing that market expectations could be too optimistic relative to execution and funding risks.
These two narratives sit on opposite sides of the current price and give you a structured way to test your own view on growth, margins and funding. If you want to go deeper into the assumptions behind them and see the full range of community views, including other bullish and cautious takes, See what the community is saying about Rivian Automotive.
Do you think there's more to the story for Rivian Automotive? Head over to our Community to see what others are saying!

This article by Simply Wall St is general in nature. We provide commentary based on historical data and analyst forecasts only using an unbiased methodology and our articles are not intended to be financial advice. It does not constitute a recommendation to buy or sell any stock, and does not take account of your objectives, or your financial situation. We aim to bring you long-term focused analysis driven by fundamental data. Note that our analysis may not factor in the latest price-sensitive company announcements or qualitative material. Simply Wall St has no position in any stocks mentioned.