Is Roku (ROKU) Pricing Reflecting Its Mixed Valuation Signals After Recent Share Price Weakness
Roku, Inc. Class A ROKU | 97.66 | +2.91% |
- If you are wondering whether Roku's current share price lines up with its underlying worth, you are not alone. This article is set up to help you connect the dots between the story and the numbers.
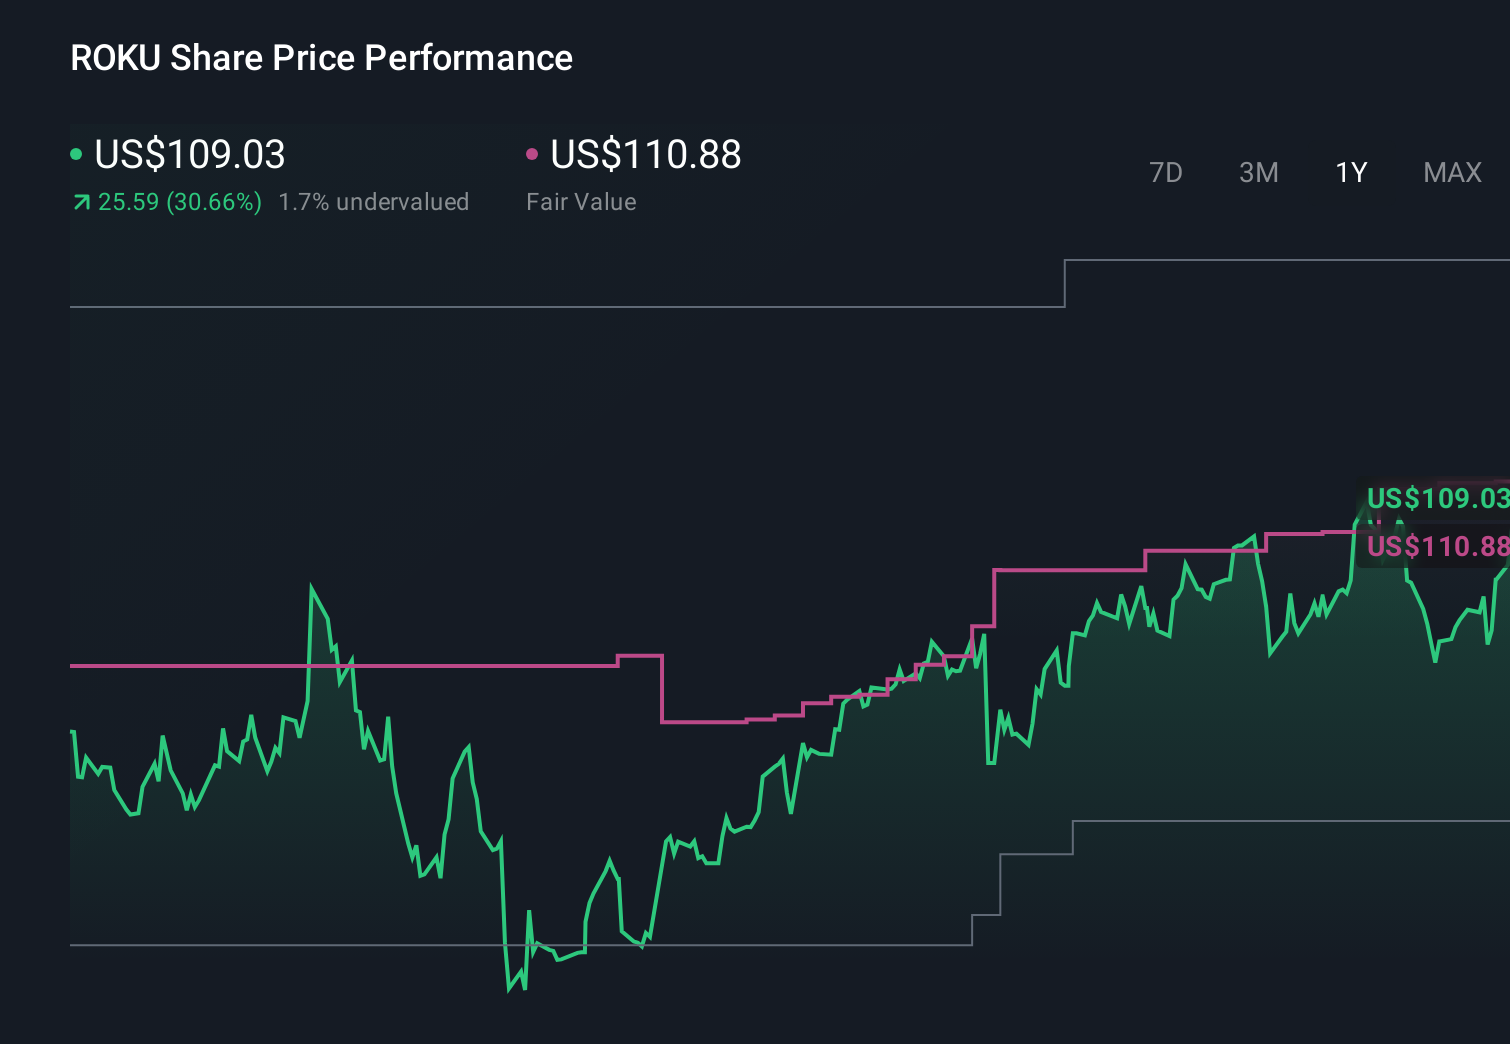
- Roku's share price closed at US$85.85, with returns of 9.8% decline over 7 days, 22.2% decline over 30 days, 21.0% decline year to date, 1.0% over 1 year, 56.4% over 3 years, and 81.7% decline over 5 years. This hints that market sentiment around risk and potential has shifted more than once.
- Recent headlines around Roku have focused on its role as a major streaming platform, its scale in connected TV devices, and ongoing competition with other media and tech players. This helps explain why expectations and risk appetite have been so changeable. Together, these themes help frame why shorter term price moves look quite different from the longer term return record.
- On our valuation check framework Roku scores 4 out of 6. This points to some areas where the market price and our assessment of value differ. Next we will walk through the key valuation approaches behind that score before closing with an even more practical way to think about Roku's valuation at the end of the article.
Approach 1: Roku Discounted Cash Flow (DCF) Analysis
A Discounted Cash Flow, or DCF, model takes estimates of the cash a business could generate in the future and discounts those back into today’s dollars to arrive at an estimate of what the whole company might be worth now.
For Roku, the model used is a 2 Stage Free Cash Flow to Equity approach. The latest twelve month free cash flow is about $394.9 million. Analyst estimates and extrapolations point to free cash flow of $1,574.6 million in 2030, with intermediate annual projections between 2026 and 2035 that Simply Wall St discounts back to today using its own assumptions.
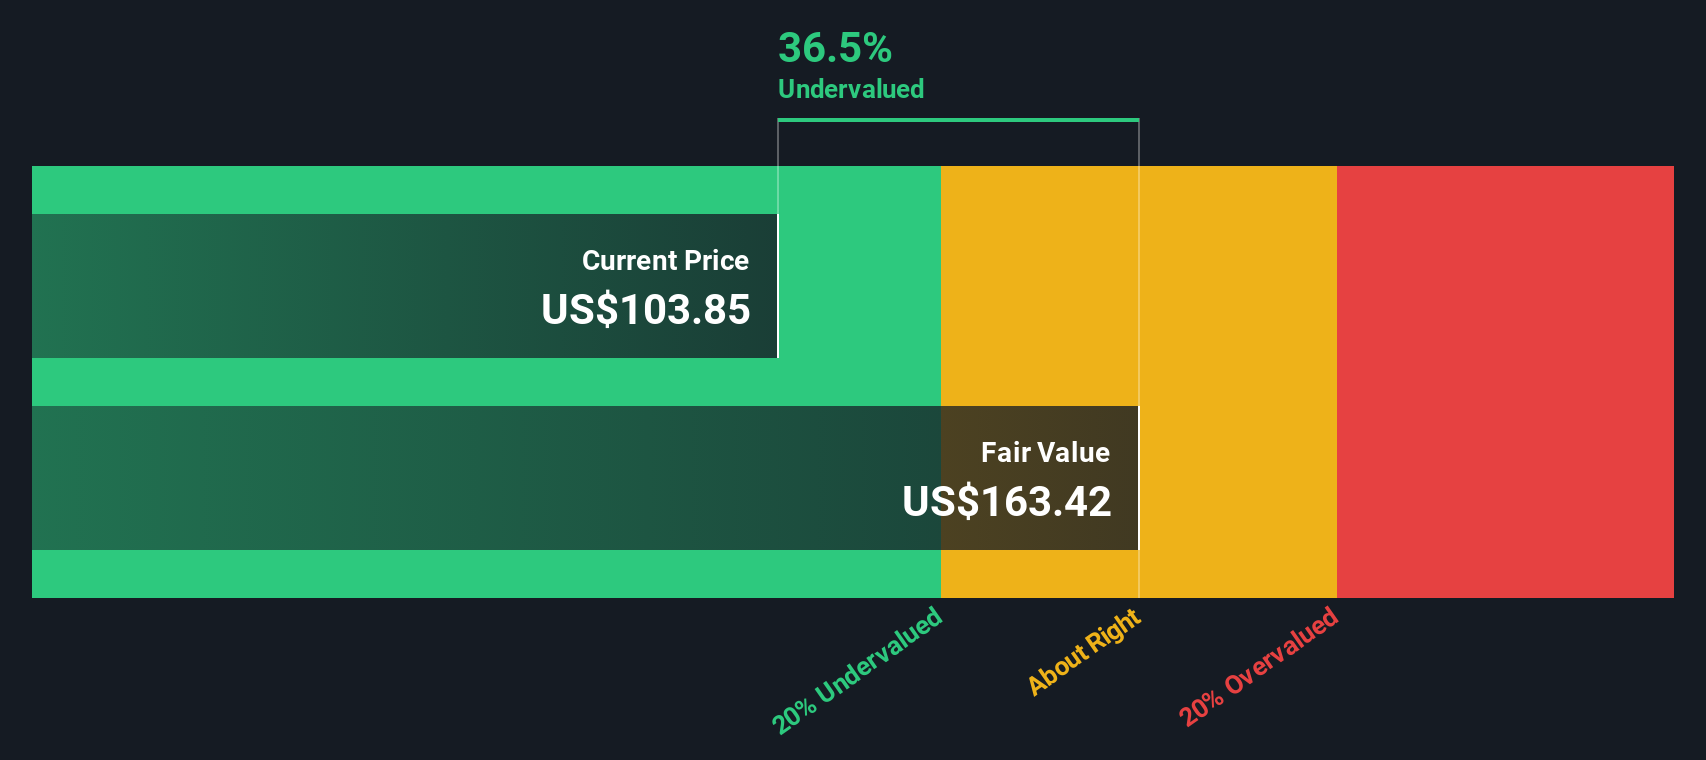
Pulling all of those discounted cash flows together results in an estimated intrinsic value of US$188.87 per share, compared with the current share price of US$85.85. On this basis, the DCF output suggests Roku trades at about a 54.5% discount to that intrinsic estimate, which screens as materially undervalued on this model alone.
Result: UNDERVALUED
Our Discounted Cash Flow (DCF) analysis suggests Roku is undervalued by 54.5%. Track this in your watchlist or portfolio, or discover 53 more high quality undervalued stocks.
Approach 2: Roku Price vs Sales (P/S)
For companies where earnings are limited or volatile, the Price to Sales ratio, or P/S, is often a more useful yardstick because it compares what investors are paying to the revenue the business is already generating.
Growth expectations and risk still matter a lot here, because faster revenue growth or lower perceived risk can justify a higher P/S multiple, while slower growth or higher uncertainty usually points to a lower, more cautious range.
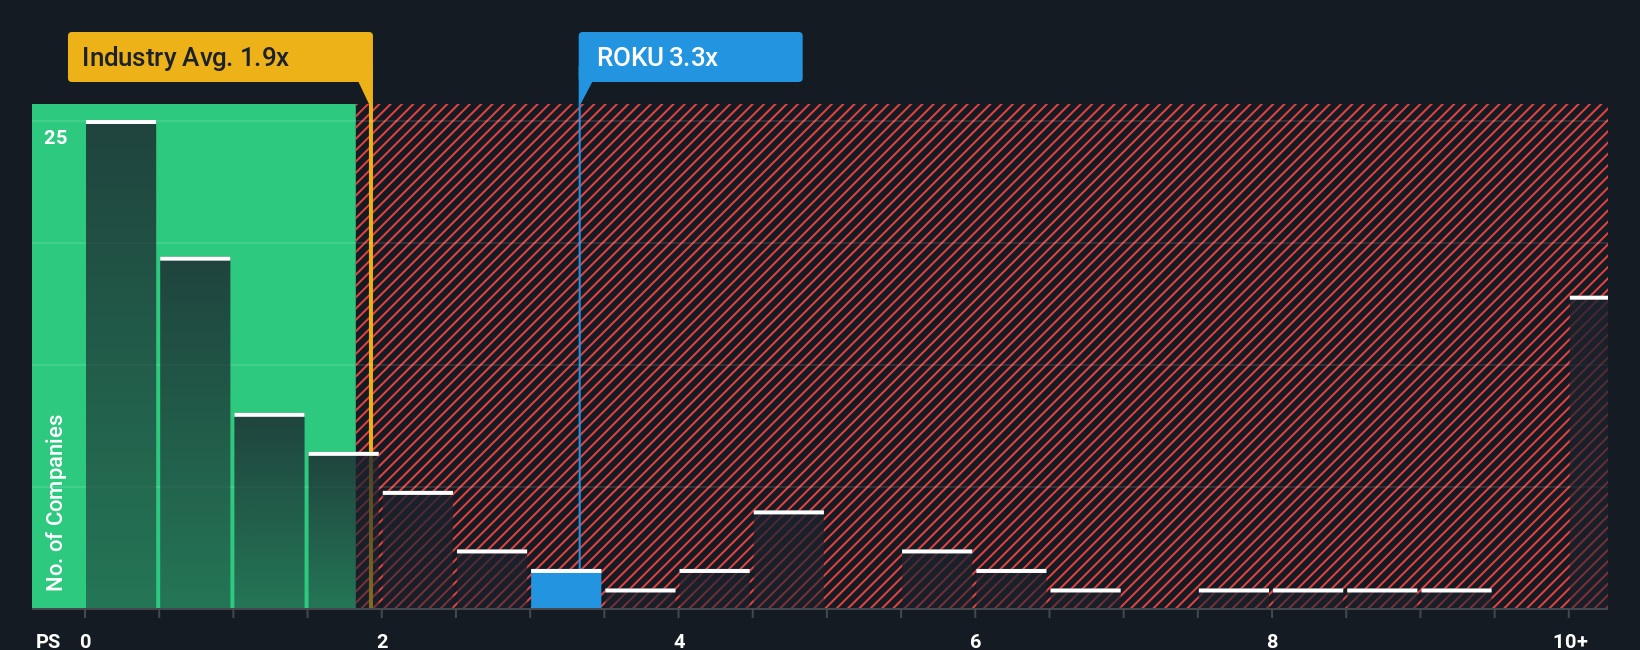
Roku currently trades on a P/S ratio of 2.79x. That sits above the Entertainment industry average of 1.36x but below the peer group average of 3.59x, so the headline comparison sends a mixed message.
Simply Wall St’s Fair Ratio for Roku is 2.31x. This is a proprietary estimate of what P/S might be reasonable after weighing factors such as earnings growth, profit margins, industry, market cap and company specific risks. Because it tailors the benchmark to Roku’s own profile, it can be more informative than a simple industry or peer comparison.
With Roku’s current 2.79x P/S sitting above the 2.31x Fair Ratio, this framework points to the shares screening as somewhat expensive on a sales based view.
Result: OVERVALUED
P/S ratios tell one story, but what if the real opportunity lies elsewhere? Start investing in legacies, not executives. Discover our 22 top founder-led companies.
Upgrade Your Decision Making: Choose your Roku Narrative
Earlier we mentioned that there is an even better way to understand valuation, so let us introduce you to Narratives, which let you attach a clear story, your view on Roku’s future revenue, earnings and margins, to a financial forecast and then to a fair value. On Simply Wall St, within the Community page used by millions of investors, you can pick or create a Narrative that links Roku’s business story to specific assumptions and see the fair value that drops out, then compare that fair value to the current share price to help you decide whether it may be closer to a buy, a hold or a sell for you. Narratives update automatically when new information such as earnings releases or major news is added, so your story and numbers stay aligned without you needing to rebuild models. For Roku, one investor might use a Narrative that expects stronger revenue growth and higher long term margins than another investor who uses more conservative assumptions, and their fair values for the same stock can sit at opposite ends of the current community range.
Do you think there's more to the story for Roku? Head over to our Community to see what others are saying!
This article by Simply Wall St is general in nature. We provide commentary based on historical data and analyst forecasts only using an unbiased methodology and our articles are not intended to be financial advice. It does not constitute a recommendation to buy or sell any stock, and does not take account of your objectives, or your financial situation. We aim to bring you long-term focused analysis driven by fundamental data. Note that our analysis may not factor in the latest price-sensitive company announcements or qualitative material. Simply Wall St has no position in any stocks mentioned.