Is Roper Technologies (ROP) Now An Opportunity After A 44% One Year Share Price Slide
Roper Technologies, Inc. ROP | 0.00 |
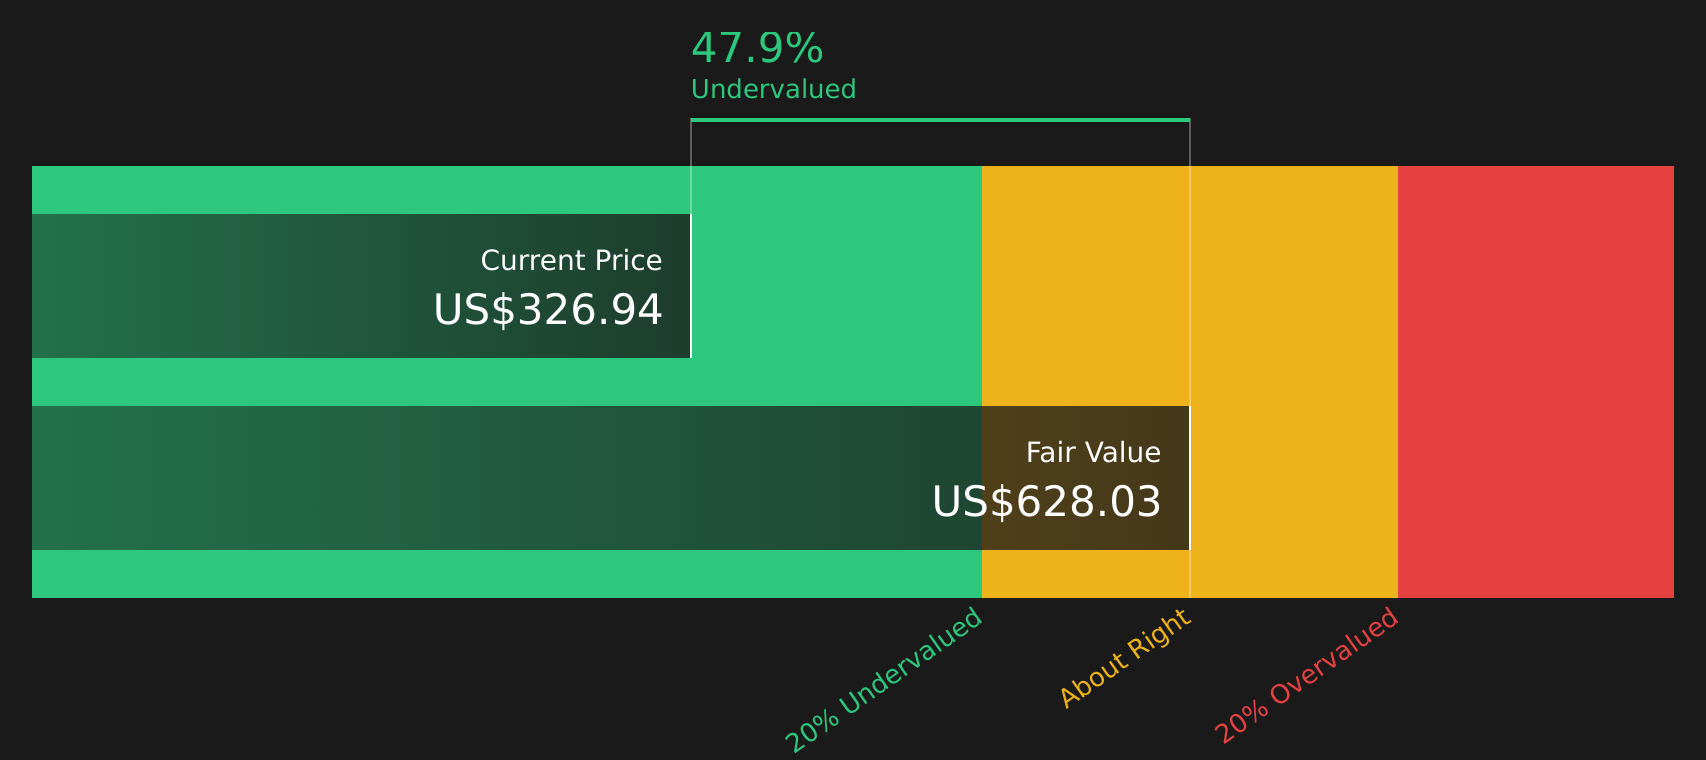
- If you are wondering whether Roper Technologies at around US$320.90 is priced for opportunity or risk, the current valuation story is worth a closer look.
- The stock has been under pressure, with the share price down 2.4% over the past week, 11.5% over the past month, 26.2% year to date and 44.3% over the past year.
- Recent headlines have focused on Roper Technologies as a long established software and technology group with a portfolio of niche, cash generative businesses, which helps frame how investors think about these share price moves. Coverage has also highlighted its acquisition led history and role as part of the broader US software sector, giving extra context to current sentiment around the stock.
- Even so, the company records a valuation score of 6 out of 6 on Simply Wall St's checks for signs of being undervalued. The sections that follow will walk through the key valuation methods investors commonly use, before turning to a more rounded way to think about what the stock might be worth.
Approach 1: Roper Technologies Discounted Cash Flow (DCF) Analysis
A Discounted Cash Flow, or DCF, model estimates what a stock could be worth by projecting future cash flows and discounting them back to today using a required return. It is essentially asking what those future dollars are worth in today's terms.
For Roper Technologies, the model uses a 2 Stage Free Cash Flow to Equity approach based on cash flow projections. The latest twelve month free cash flow is about $2.48b. Analyst estimates and Simply Wall St extrapolations project free cash flow rising to around $5.34b by 2035, with intermediate years such as 2029 at $3.74b. These future cash flows are discounted back to the present and summed.
On this basis, the DCF model outputs an estimated intrinsic value of about $626.25 per share, compared with a current share price of roughly $320.90. That gap implies the stock trades at about a 48.8% discount to this DCF estimate, which indicates a valuation that appears materially below the modelled fair value.
Result: UNDERVALUED
Our Discounted Cash Flow (DCF) analysis suggests Roper Technologies is undervalued by 48.8%. Track this in your watchlist or portfolio, or discover 51 more high quality undervalued stocks.
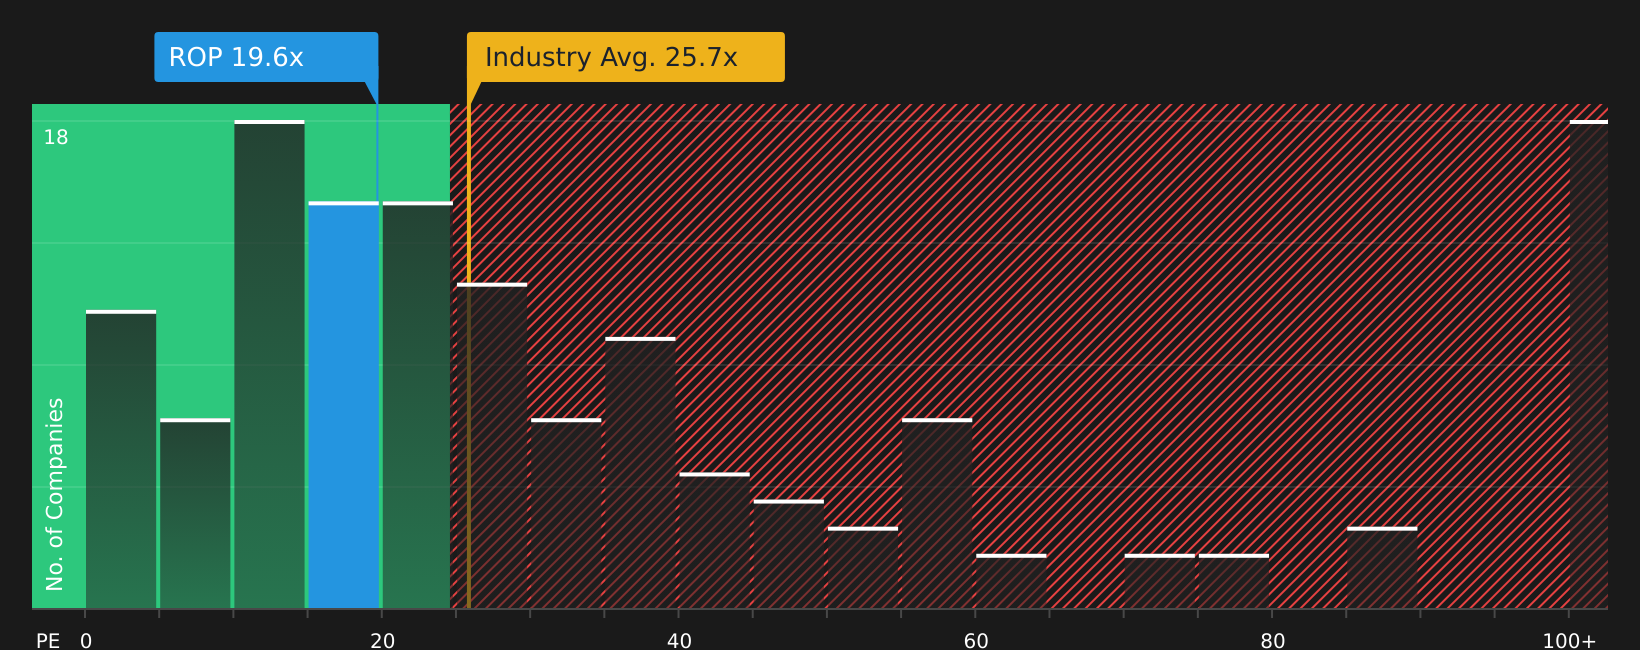
Approach 2: Roper Technologies Price vs Earnings
For profitable companies, the P/E ratio is a useful shorthand for what you are paying for each dollar of earnings. It reflects what the market is willing to pay today based on expectations for future growth and the perceived risk of those earnings.
Higher growth prospects or lower perceived risk usually justify a higher P/E, while slower growth or higher risk tend to come with a lower, more cautious multiple. So the question is not just whether a P/E is high or low, but whether it fits the company’s profile.
Roper Technologies currently trades on a P/E of 18.9x. That sits below the Software industry average P/E of 28.3x and the peer group average of 34.6x. Simply Wall St’s Fair Ratio for Roper Technologies is 23.6x. This is a proprietary view of what the P/E could be given factors such as earnings growth, profit margins, industry, market cap and specific risks, which makes it more tailored than a simple comparison with industry or peer averages.
With the current P/E of 18.9x sitting below the Fair Ratio of 23.6x, the stock screens as undervalued on this earnings multiple basis.
Result: UNDERVALUED
P/E ratios tell one story, but what if the real opportunity lies elsewhere? Start investing in legacies, not executives. Discover our 18 top founder-led companies.
Upgrade Your Decision Making: Choose your Roper Technologies Narrative
Earlier it was mentioned that there is an even better way to understand valuation. Meet Narratives, a simple way for you to connect your view of Roper Technologies with the numbers by telling a story about its future, linking that story to forecasts for revenue, earnings and margins, and then seeing a fair value that you can compare with today’s share price to decide whether you see opportunity or risk.
On Simply Wall St’s Community page, Narratives are easy to use and update automatically as new news or earnings arrive, so you always see a fresh fair value instead of a static target.
For example, one investor might build a bullish Roper Technologies Narrative that lines up with a fair value around US$694.0, while another might prefer a more cautious Narrative closer to US$419.0. By setting these side by side with the current price, you can quickly see which story best matches your expectations and risk tolerance.
Do you think there's more to the story for Roper Technologies? Head over to our Community to see what others are saying!

This article by Simply Wall St is general in nature. We provide commentary based on historical data and analyst forecasts only using an unbiased methodology and our articles are not intended to be financial advice. It does not constitute a recommendation to buy or sell any stock, and does not take account of your objectives, or your financial situation. We aim to bring you long-term focused analysis driven by fundamental data. Note that our analysis may not factor in the latest price-sensitive company announcements or qualitative material. Simply Wall St has no position in any stocks mentioned.