Is RPM International (RPM) Shares Offering Value After Recent Price Rebound?
RPM International Inc. RPM | 97.97 | -2.64% |
- Investors may be wondering whether RPM International, at around US$111 per share, currently offers good value or whether the price already reflects the story that investors are paying for.
- The stock has returned 7.0% over the last week and 6.2% over the last month, while the 1 year return of a 6.2% decline contrasts with longer term returns of 34.6% over 3 years and 40.2% over 5 years.
- Recent attention on RPM International has focused on how its long term returns compare with shorter term share price moves, as investors reassess what they are willing to pay for the business. This context helps frame whether the current price aligns with the company’s fundamentals or whether expectations have shifted.
- On our checks, RPM International scores a 3 out of 6 valuation score. Next, we look at how different valuation approaches line up with this and then finish by discussing a more complete way to think about valuation beyond a single number.
Approach 1: RPM International Discounted Cash Flow (DCF) Analysis
A Discounted Cash Flow (DCF) model estimates what a company might be worth today by projecting future cash flows and then discounting those back to the present. It is essentially asking what future cash generated for shareholders is worth in today’s dollars.
For RPM International, the model used is a 2 Stage Free Cash Flow to Equity approach, based on cash flow projections. The latest twelve month free cash flow is about $586.6 million. Analyst forecasts and extrapolated estimates see free cash flow reaching $833.5 million by 2028 and rising to $1,203.3 million by 2035, with each of these future figures discounted back to reflect their value in today’s terms.
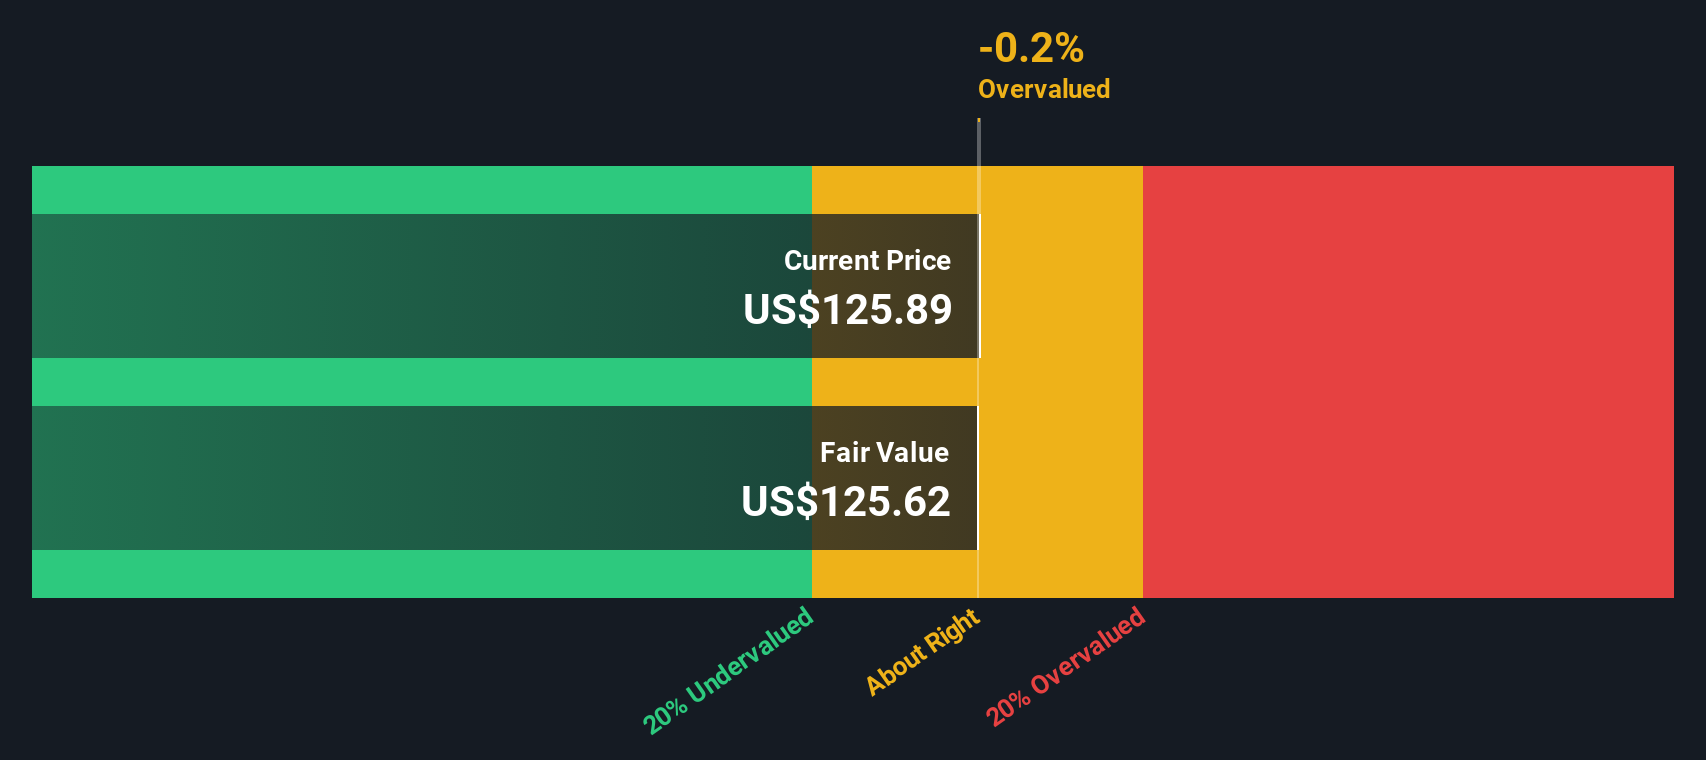
Bringing all those discounted cash flows together gives an estimated intrinsic value of about $150.99 per share, compared with a current share price around $111. On this basis, the DCF suggests RPM International trades at about a 26.5% discount to that intrinsic value, which indicates that the shares appear undervalued on this model alone.
Result: UNDERVALUED
Our Discounted Cash Flow (DCF) analysis suggests RPM International is undervalued by 26.5%. Track this in your watchlist or portfolio, or discover 879 more undervalued stocks based on cash flows.
Approach 2: RPM International Price vs Earnings
For a profitable company like RPM International, the P/E ratio is a useful anchor because it directly links what you pay per share to the earnings the business is currently generating. It lets you see how many dollars investors are willing to pay today for each dollar of earnings.
What counts as a “normal” or “fair” P/E depends on how the market views a company’s growth prospects and risk. Higher expected growth or lower perceived risk can justify a higher P/E, while lower growth or higher risk usually lines up with a lower P/E.
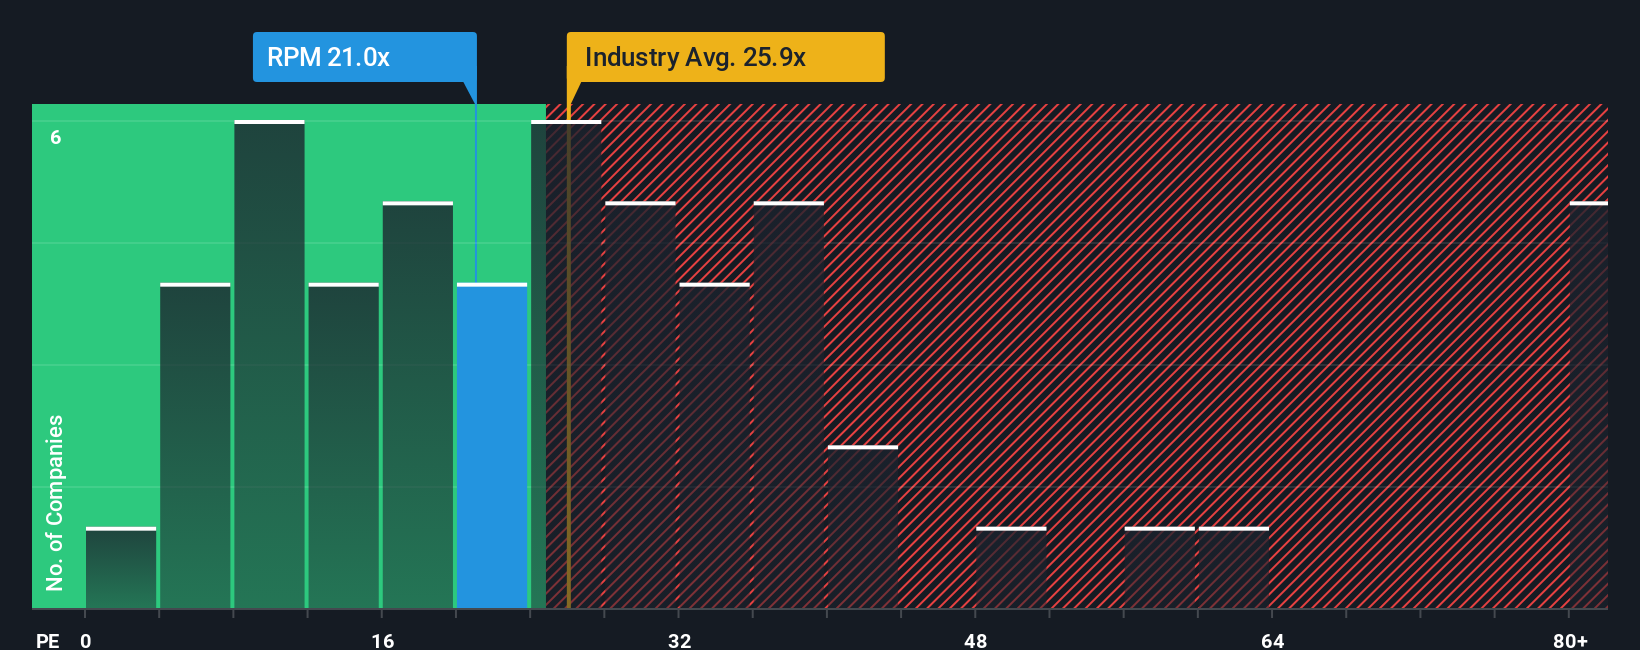
RPM International currently trades on a P/E of about 21.4x. That is close to its peer group average of 21.3x and below the broader Chemicals industry average of about 25.2x. Simply Wall St’s “Fair Ratio” for RPM International is 21.3x, which is its estimate of an appropriate P/E given the company’s earnings growth profile, profit margins, size, risks and industry.
This Fair Ratio can be more useful than a simple peer or industry comparison because it adjusts for RPM International’s specific characteristics rather than assuming all companies deserve the same multiple.
With the actual P/E at 21.4x and the Fair Ratio at 21.3x, the shares look priced at roughly a fair level on this metric.
Result: ABOUT RIGHT
P/E ratios tell one story, but what if the real opportunity lies elsewhere? Discover 1444 companies where insiders are betting big on explosive growth.
Upgrade Your Decision Making: Choose your RPM International Narrative
Earlier we mentioned that there is an even better way to understand valuation, so let us introduce Narratives. With Narratives, you spell out your story for RPM International by linking your assumptions for fair value, future revenue, earnings and margins to a clear forecast. You can then compare that Fair Value to the current price on Simply Wall St’s Community page, which is used by millions of investors. The Narrative updates automatically as fresh news or earnings arrive. For example, one RPM International Narrative might lean toward the higher US$152 analyst price target with stronger confidence in recurring revenues and margin expansion. Another might center on the lower US$117 target with more weight on risks such as high debt and input costs. This gives you two different but transparent stories to compare against today’s share price when deciding whether the stock looks rich or offers room for upside based on your own view.
Do you think there's more to the story for RPM International? Head over to our Community to see what others are saying!

This article by Simply Wall St is general in nature. We provide commentary based on historical data and analyst forecasts only using an unbiased methodology and our articles are not intended to be financial advice. It does not constitute a recommendation to buy or sell any stock, and does not take account of your objectives, or your financial situation. We aim to bring you long-term focused analysis driven by fundamental data. Note that our analysis may not factor in the latest price-sensitive company announcements or qualitative material. Simply Wall St has no position in any stocks mentioned.