Is RTX (RTX) Still Fairly Priced After Recent Share Price Pullback?
RAYTHEON TECHNOLOGIES CORPORATION RTX | 0.00 |
- If you are wondering whether RTX at around US$172.55 a share offers fair value or is starting to look stretched, the valuation picture is the key place to focus.
- RTX's share price has pulled back slightly in the short term, declining 2.3% over the last week and 0.2% over the last month, and is also down 7.9% year to date, even though it is still up 26.5% over 1 year, 86.5% over 3 years and 116.8% over 5 years.
- These mixed returns arrive as investors continue to weigh broader defense and aerospace spending trends along with RTX's ongoing portfolio of commercial and military programs. Recent attention on the sector has kept interest high in companies like RTX, even when the share price takes a breather.
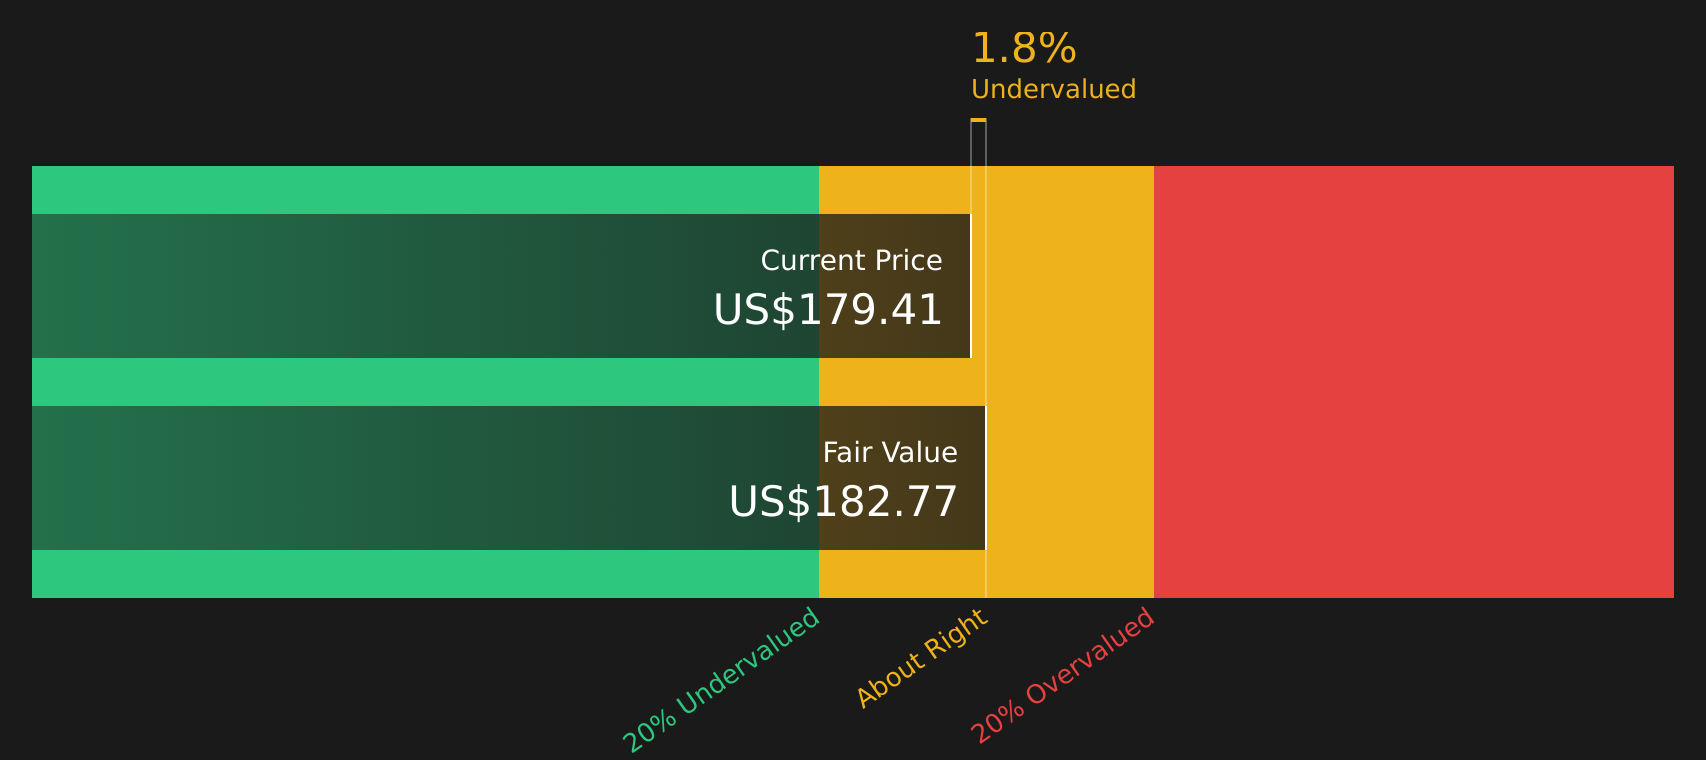
- RTX currently has a valuation score of 4 out of 6, which means it screens as undervalued on four of six checks. The next sections will break down what different valuation methods say about the stock and point to a more complete way to think about value by the end of the article.
Approach 1: RTX Discounted Cash Flow (DCF) Analysis
A Discounted Cash Flow, or DCF, model estimates what a stock could be worth by projecting future cash flows and discounting them back to today, so you can compare that value with the current share price.
For RTX, the model uses a 2 Stage Free Cash Flow to Equity approach, starting from last twelve months free cash flow of about $7.6b. Analyst and extrapolated projections run out to 2035, with the 2030 free cash flow projection at $13.0b and discounted values provided for each year in between. These figures are all in $ and aim to capture what RTX might generate for equity holders over time.
Pulling all of those discounted cash flows together, the model arrives at an estimated intrinsic value of $167.12 per share. Compared with the recent share price of about $172.55, the DCF output suggests RTX is roughly 3.2% overvalued. This is a relatively small gap and well within the sort of margin that many investors might see as normal noise.
Result: ABOUT RIGHT
RTX is fairly valued according to our Discounted Cash Flow (DCF), but this can change at a moment's notice. Track the value in your watchlist or portfolio and be alerted on when to act.
Approach 2: RTX Price vs Earnings
For a profitable company like RTX, the P/E ratio is a useful way to think about value because it links what you pay directly to the earnings the company is generating today. In general, higher growth expectations and lower perceived risk can support a higher P/E, while slower expected growth or higher risk usually point to a lower, more conservative P/E range.
RTX currently trades on a P/E of 32.0x. This sits below the Aerospace & Defense industry average P/E of about 40.0x and below the broader peer group average of 51.6x. Simply Wall St also provides a proprietary “Fair Ratio” for RTX of 34.8x, which is an estimate of what RTX’s P/E might be given its earnings growth profile, industry, profit margins, market cap and risk characteristics.
This Fair Ratio is more tailored than a simple comparison against peers or the industry, because it adjusts for company specific features rather than assuming every stock deserves the same multiple. Comparing RTX’s current P/E of 32.0x with the Fair Ratio of 34.8x suggests the stock screens as undervalued on this metric.
Result: UNDERVALUED

P/E ratios tell one story, but what if the real opportunity lies elsewhere? Start investing in legacies, not executives. Discover our 20 top founder-led companies.
Upgrade Your Decision Making: Choose your RTX Narrative
Earlier it was mentioned that there is an even better way to understand valuation. Narratives on Simply Wall St let you attach a clear story to your numbers by linking what you believe about RTX’s contracts, engine upgrades, risks and opportunities to a financial forecast. This then flows through to a fair value that you can compare with the current share price on the Community page. It will update automatically when fresh news or earnings arrive, and you can customize it to your view, whether you are closer to the higher analyst fair value around US$242 or the more cautious end near US$180.
Do you think there's more to the story for RTX? Head over to our Community to see what others are saying!

This article by Simply Wall St is general in nature. We provide commentary based on historical data and analyst forecasts only using an unbiased methodology and our articles are not intended to be financial advice. It does not constitute a recommendation to buy or sell any stock, and does not take account of your objectives, or your financial situation. We aim to bring you long-term focused analysis driven by fundamental data. Note that our analysis may not factor in the latest price-sensitive company announcements or qualitative material. Simply Wall St has no position in any stocks mentioned.