Is ServiceNow (NOW) Mispriced After Its Sharp Share Price Pullback?
ServiceNow, Inc. NOW | 102.00 | -1.96% |
- If you are wondering whether ServiceNow shares still line up with the price on your screen, this article will walk through what that current market value might really imply.
- The stock last closed at US$103.87, after recent returns of 12.0% decline over 7 days, 26.7% decline over 30 days, 29.6% decline year to date, 49.2% decline over 1 year, 12.6% over 3 years, and 12.2% decline over 5 years.
- Recent coverage around ServiceNow has focused on how investors are reassessing high growth software names and what that means for companies in the workflow and automation space. This mix of sentiment and sector level discussion helps frame the sharp pullback in the share price.
- Right now, ServiceNow has a valuation score of 2 out of 6, which suggests some potential pockets of value that are not consistent across every metric, and we will walk through those methods before finishing with a different way to think about valuation that can be even more helpful.
ServiceNow scores just 2/6 on our valuation checks. See what other red flags we found in the full valuation breakdown.
Approach 1: ServiceNow Discounted Cash Flow (DCF) Analysis
A Discounted Cash Flow, or DCF, model estimates what a business could be worth today by projecting its future cash flows and then discounting those back into today’s dollars.
For ServiceNow, the model used is a 2 Stage Free Cash Flow to Equity approach based on cash flow projections. The company’s latest twelve month Free Cash Flow is about $4.45b. Analyst inputs and extrapolated estimates suggest projected Free Cash Flow reaching $9.49b in 2030, with a series of annual projections between 2026 and 2035 that are discounted back to present value.
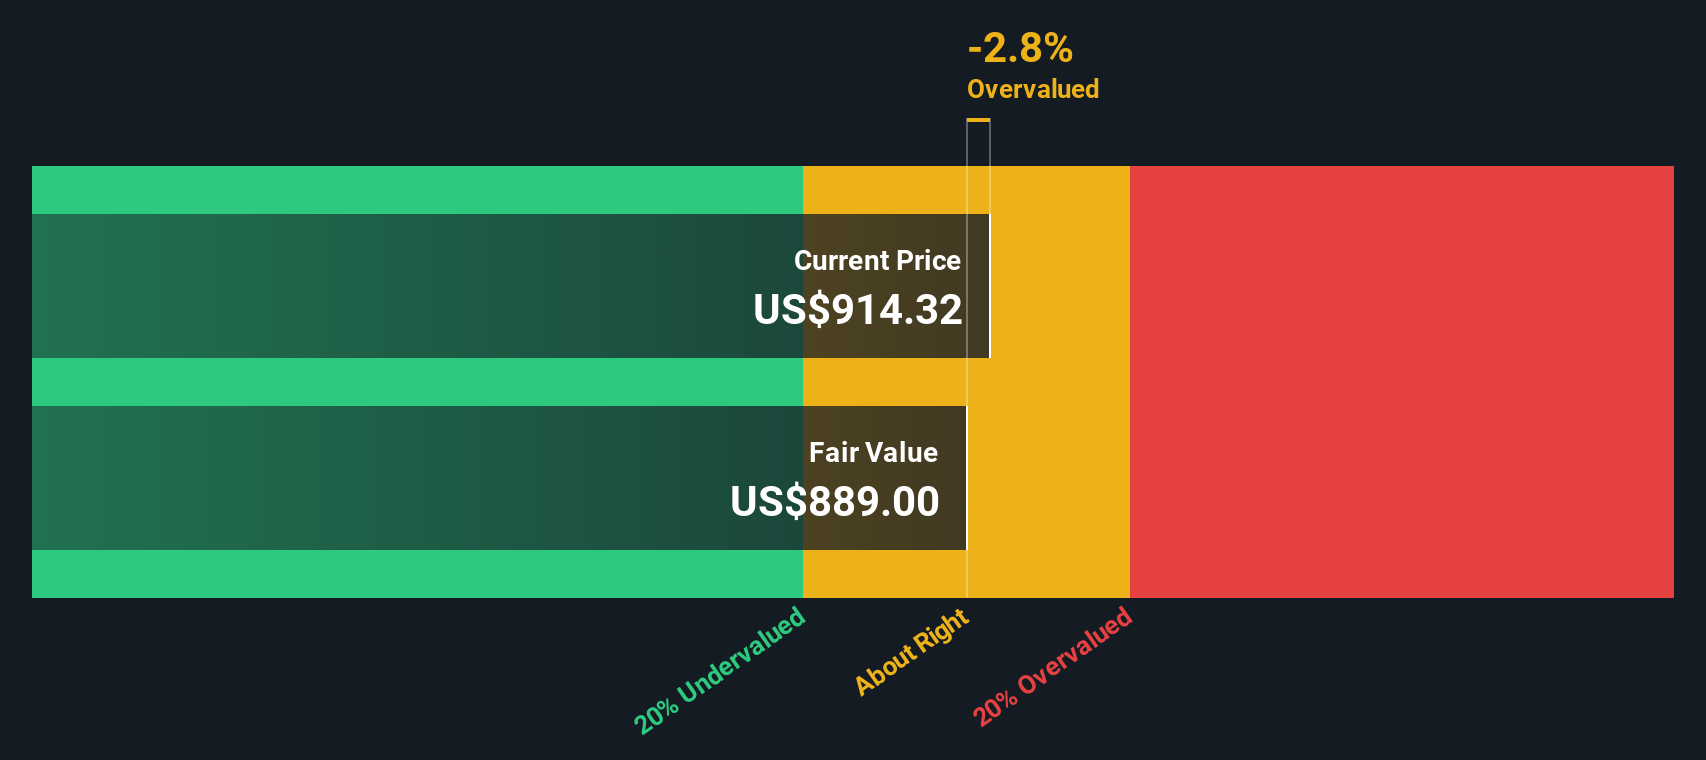
Pulling those discounted cash flows together gives an estimated intrinsic value of US$168.20 per share. Compared with the recent share price of US$103.87, the DCF implies the stock trades at a 38.2% discount to this estimate, which the model interprets as undervalued.
Result: UNDERVALUED
Our Discounted Cash Flow (DCF) analysis suggests ServiceNow is undervalued by 38.2%. Track this in your watchlist or portfolio, or discover 52 more high quality undervalued stocks.
Approach 2: ServiceNow Price vs Earnings
For profitable companies, the P/E ratio is a useful way to connect what you pay for each share with the earnings that business is currently generating. It helps you see how many dollars the market is willing to pay today for each dollar of earnings.
What counts as a “normal” P/E will usually reflect how fast earnings are expected to grow and how risky those earnings are. Higher expected growth or lower perceived risk can support a higher P/E, while slower growth or higher risk usually points to a lower P/E.
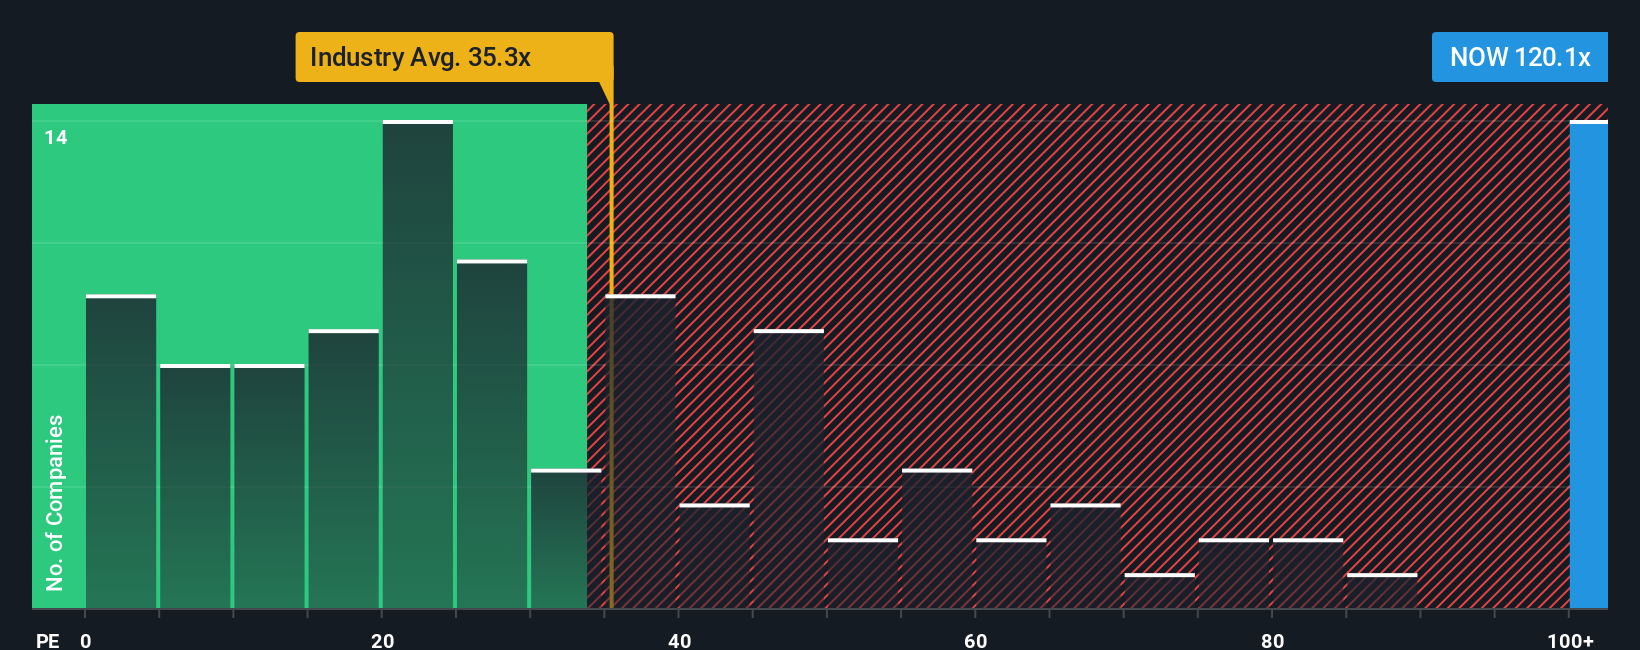
ServiceNow currently trades on a P/E of 62.16x. That sits above the Software industry average of 27.99x and above the peer group average of 46.63x. On simple comparisons, the shares carry a richer earnings multiple than many alternatives.
Simply Wall St’s Fair Ratio is a proprietary P/E estimate that tries to adjust for the company’s own profile, including earnings growth, profit margins, industry, market cap and risk. Because it is tailored to the business, it can be more useful than broad industry or peer averages that treat very different companies as if they were the same.
For ServiceNow, the Fair Ratio is 41.24x, which is below the current 62.16x. This suggests the shares look overvalued on this P/E based view.
Result: OVERVALUED
P/E ratios tell one story, but what if the real opportunity lies elsewhere? Start investing in legacies, not executives. Discover our 22 top founder-led companies.
Upgrade Your Decision Making: Choose your ServiceNow Narrative
Earlier we mentioned that there is an even better way to think about valuation. On Simply Wall St you can use Narratives, where you tell the story behind your numbers by linking your view of ServiceNow’s future revenue, earnings and margins to a forecast and a fair value. You can then compare that fair value with today’s price on the Community page to decide whether the stock looks attractive or not. Each Narrative updates automatically when new news or earnings arrive. For example, one ServiceNow Narrative might assume a fair value around US$1,242.60 based on higher growth and margins, while another might sit closer to US$716.00 with more cautious assumptions. Both viewpoints can sit side by side for you to weigh against your own expectations.
Do you think there's more to the story for ServiceNow? Head over to our Community to see what others are saying!

This article by Simply Wall St is general in nature. We provide commentary based on historical data and analyst forecasts only using an unbiased methodology and our articles are not intended to be financial advice. It does not constitute a recommendation to buy or sell any stock, and does not take account of your objectives, or your financial situation. We aim to bring you long-term focused analysis driven by fundamental data. Note that our analysis may not factor in the latest price-sensitive company announcements or qualitative material. Simply Wall St has no position in any stocks mentioned.