Is Shake Shack (SHAK) Pricing Reflect Its Mixed Share Price Performance And Rich Valuation Metrics
Shake Shack, Inc. Class A SHAK | 99.75 100.36 | -1.40% +0.61% Post |
- If you have ever wondered whether Shake Shack's current share price reflects what you are actually getting as an investor, you are not alone.
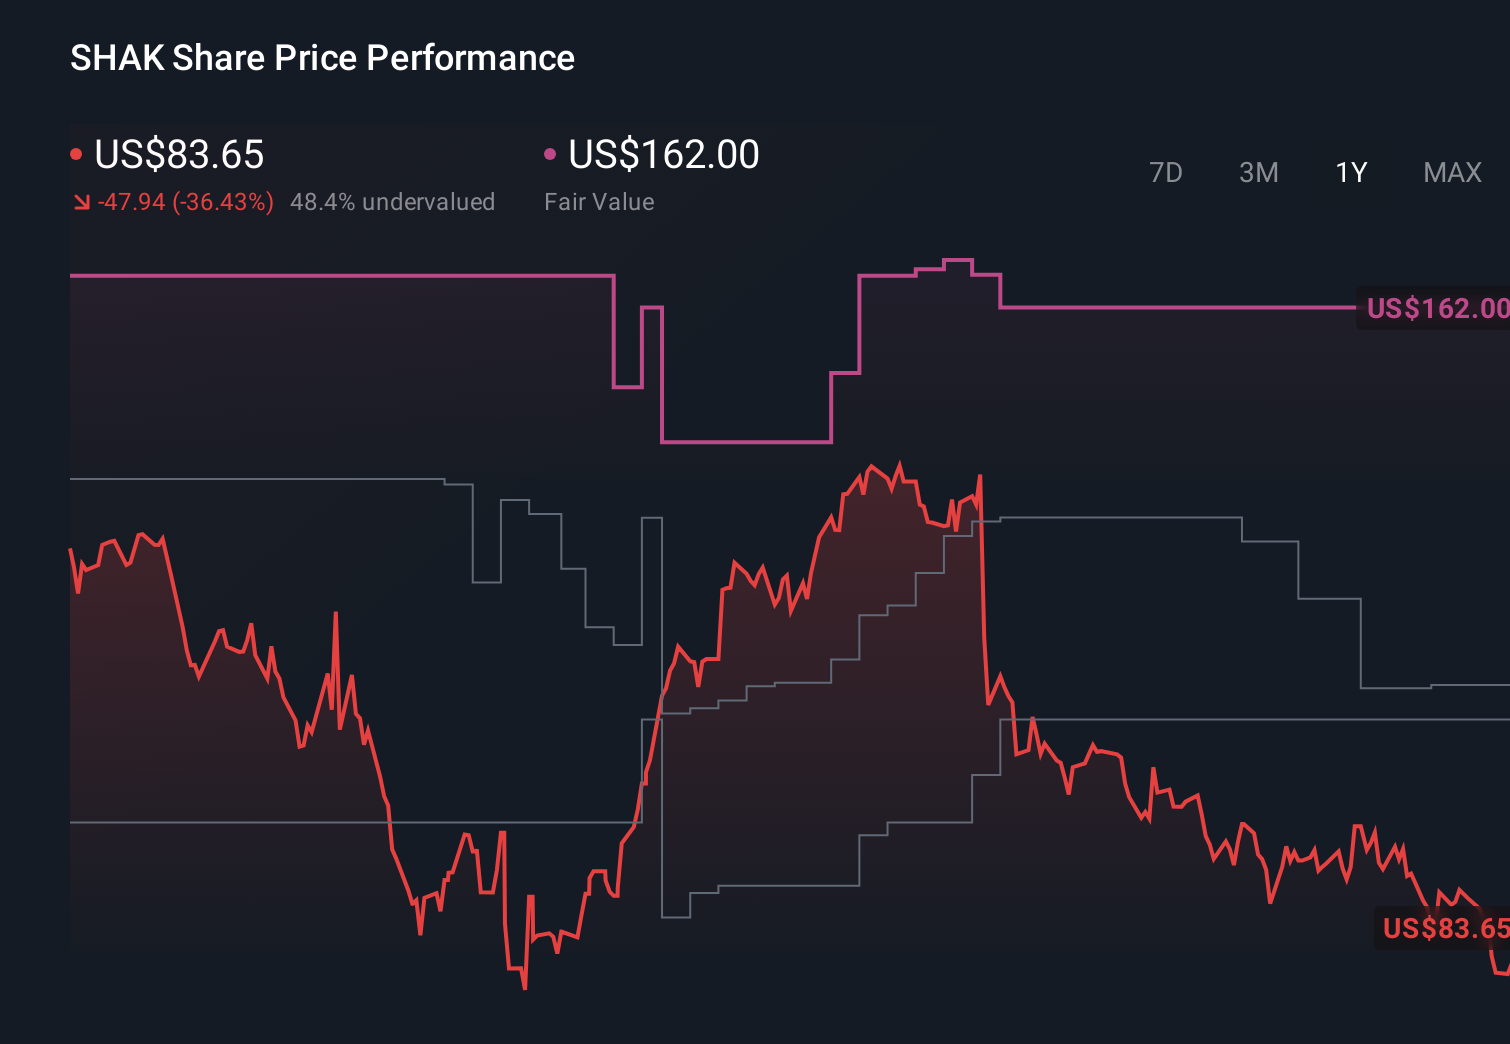
- The stock recently closed at US$93.07, with returns of 5.7% over 7 days, 3.6% over 30 days, 11.5% year to date, 64.1% over 3 years, and a 19.2% decline over 1 year. Taken together, this gives a mixed picture of how the market has been reassessing it over different timeframes.
- Recent coverage has focused on Shake Shack as a branded fast casual player listed on the NYSE and on how investors are weighing its growth history against questions about what a fair price looks like today. This backdrop helps explain why the share price has seen periods of renewed interest as well as pullbacks when expectations and valuation concerns come into focus.
- Simply Wall St currently gives Shake Shack a valuation score of 0 out of 6, which suggests the stock does not screen as undervalued on any of the checks used. Next, we will walk through the usual valuation approaches and then finish with a framework that can help you make more sense of these signals.
Shake Shack scores just 0/6 on our valuation checks. See what other red flags we found in the full valuation breakdown.
Approach 1: Shake Shack Discounted Cash Flow (DCF) Analysis
A Discounted Cash Flow, or DCF, model takes expected future cash flows and then discounts them back to today to estimate what the business might be worth on a per share basis.
For Shake Shack, Simply Wall St uses a 2 Stage Free Cash Flow to Equity model built on cash flow projections. The latest twelve month Free Cash Flow is about $38.87 million. Analysts provide Free Cash Flow estimates out to 2026, at $56.65 million, and Simply Wall St then extrapolates further, with projected Free Cash Flow reaching about $124.82 million by 2035.
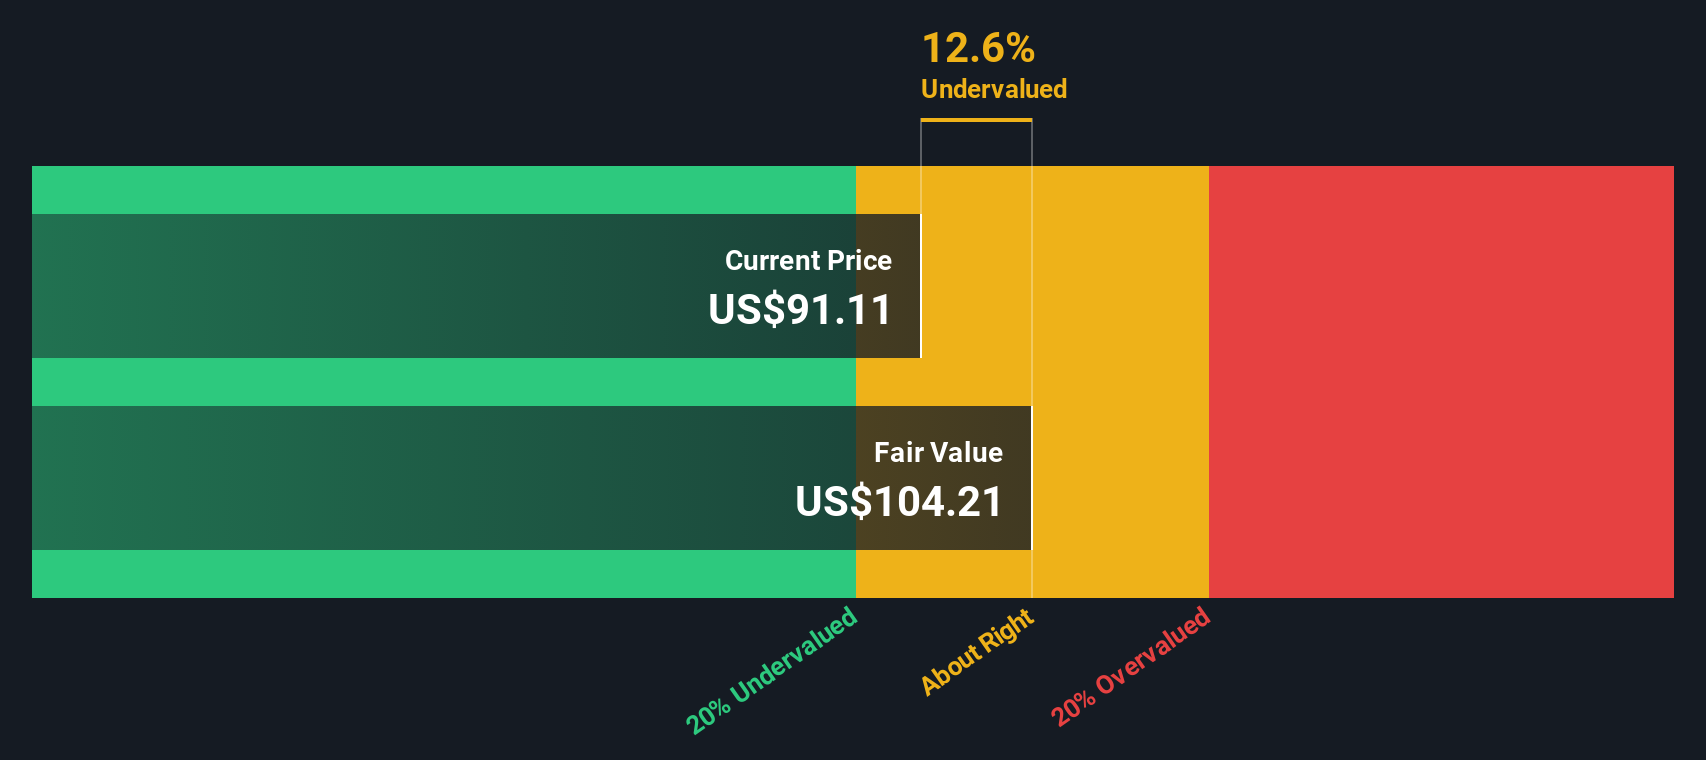
After discounting these projected cash flows back to today using the model’s assumptions, the estimated intrinsic value comes out at $37.63 per share. Compared with the recent share price of $93.07, this DCF outcome implies the shares are about 147.3% above the model’s estimate of fair value, so the stock screens as expensive on this basis.
Result: OVERVALUED
Our Discounted Cash Flow (DCF) analysis suggests Shake Shack may be overvalued by 147.3%. Discover 55 high quality undervalued stocks or create your own screener to find better value opportunities.
Approach 2: Shake Shack Price vs Earnings
For profitable companies, the P/E ratio is a straightforward way to link what you pay for each share to the earnings the business is currently generating. It gives you a quick sense of how many dollars investors are willing to pay today for one dollar of annual earnings.
What counts as a “normal” P/E ratio depends heavily on how fast earnings are expected to grow and how risky those earnings are. Higher expected growth and lower perceived risk usually justify a higher P/E, while slower growth or higher risk tend to pull a fair P/E lower.
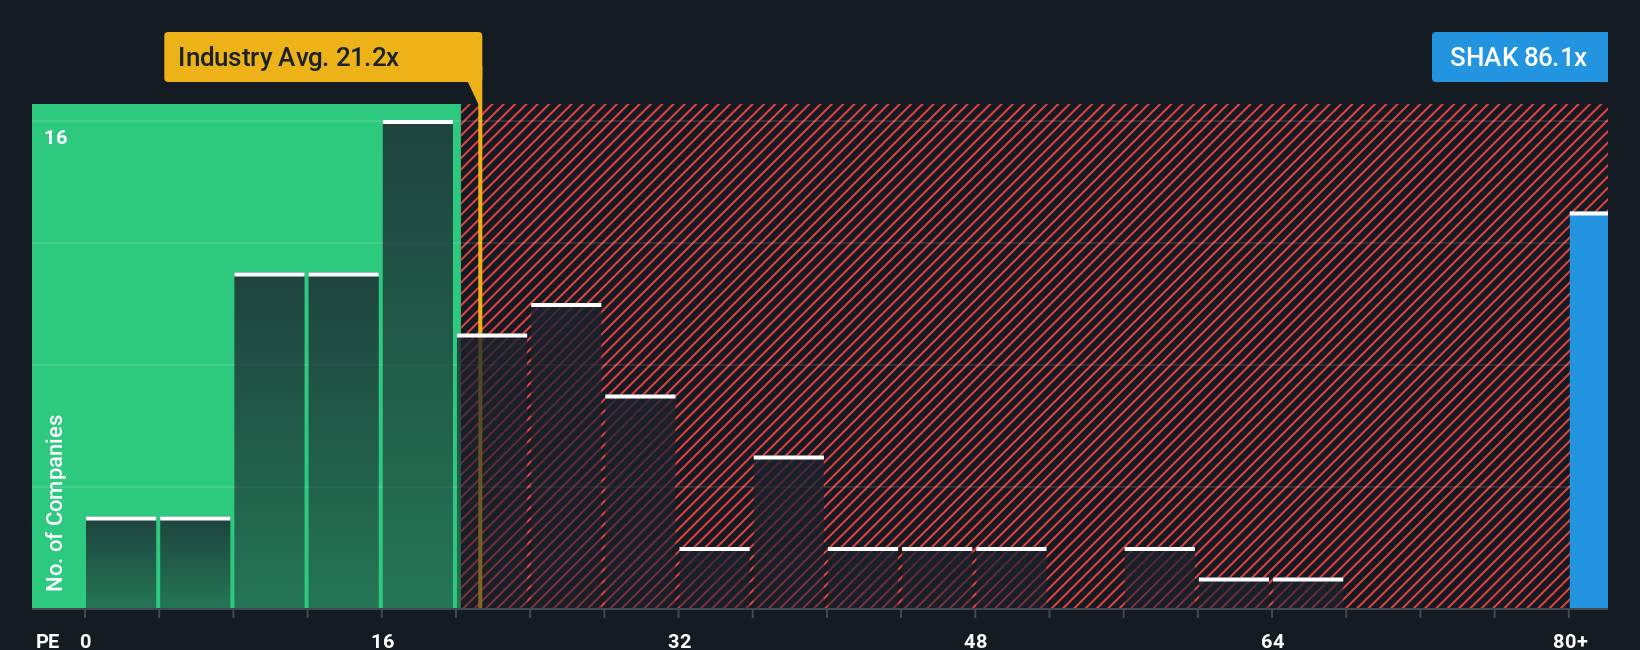
Shake Shack currently trades on a P/E of 87.94x. That sits well above the Hospitality industry average of 21.00x and above the peer group average of 32.95x. Simply Wall St’s Fair Ratio for Shake Shack is 22.17x, which is a proprietary estimate of what the P/E might be given factors such as earnings growth, industry, profit margins, market cap and company specific risks.
The Fair Ratio aims to be more tailored than a simple peer or industry comparison because it adjusts for those company level factors rather than treating all Hospitality names as alike. Compared with this 22.17x Fair Ratio, the current 87.94x P/E suggests the shares look expensive on this metric.
Result: OVERVALUED
P/E ratios tell one story, but what if the real opportunity lies elsewhere? Start investing in legacies, not executives. Discover our 22 top founder-led companies.
Upgrade Your Decision Making: Choose your Shake Shack Narrative
Earlier we mentioned that there is an even better way to understand valuation, so let us introduce you to Narratives, a simple way to connect your view of a company’s story with the numbers behind it.
A Narrative is your written perspective on a business that sits alongside your own assumptions for fair value, future revenue, earnings and margins, so the story you believe in is directly tied to a concrete forecast.
On Simply Wall St’s Community page, used by millions of investors, Narratives make this process accessible by linking a company’s story to a financial model and then to an estimated fair value that you can compare against the current share price to help decide whether you see it as an opportunity or something to avoid.
Because Narratives on the platform update when new information such as earnings releases or news arrives, your Shake Shack view can stay current, and different investors can set very different fair values for the same stock based on their own expectations for its future.
Do you think there's more to the story for Shake Shack? Head over to our Community to see what others are saying!
This article by Simply Wall St is general in nature. We provide commentary based on historical data and analyst forecasts only using an unbiased methodology and our articles are not intended to be financial advice. It does not constitute a recommendation to buy or sell any stock, and does not take account of your objectives, or your financial situation. We aim to bring you long-term focused analysis driven by fundamental data. Note that our analysis may not factor in the latest price-sensitive company announcements or qualitative material. Simply Wall St has no position in any stocks mentioned.