Is Shopify (SHOP) Pricing Too Much Growth After Recent Share Price Weakness
Shopify, Inc. Class A SHOP | 118.25 | -0.23% |
- If you are wondering whether Shopify's current share price lines up with the value of its business, you are not alone, especially given how widely opinions differ on what the stock is worth.
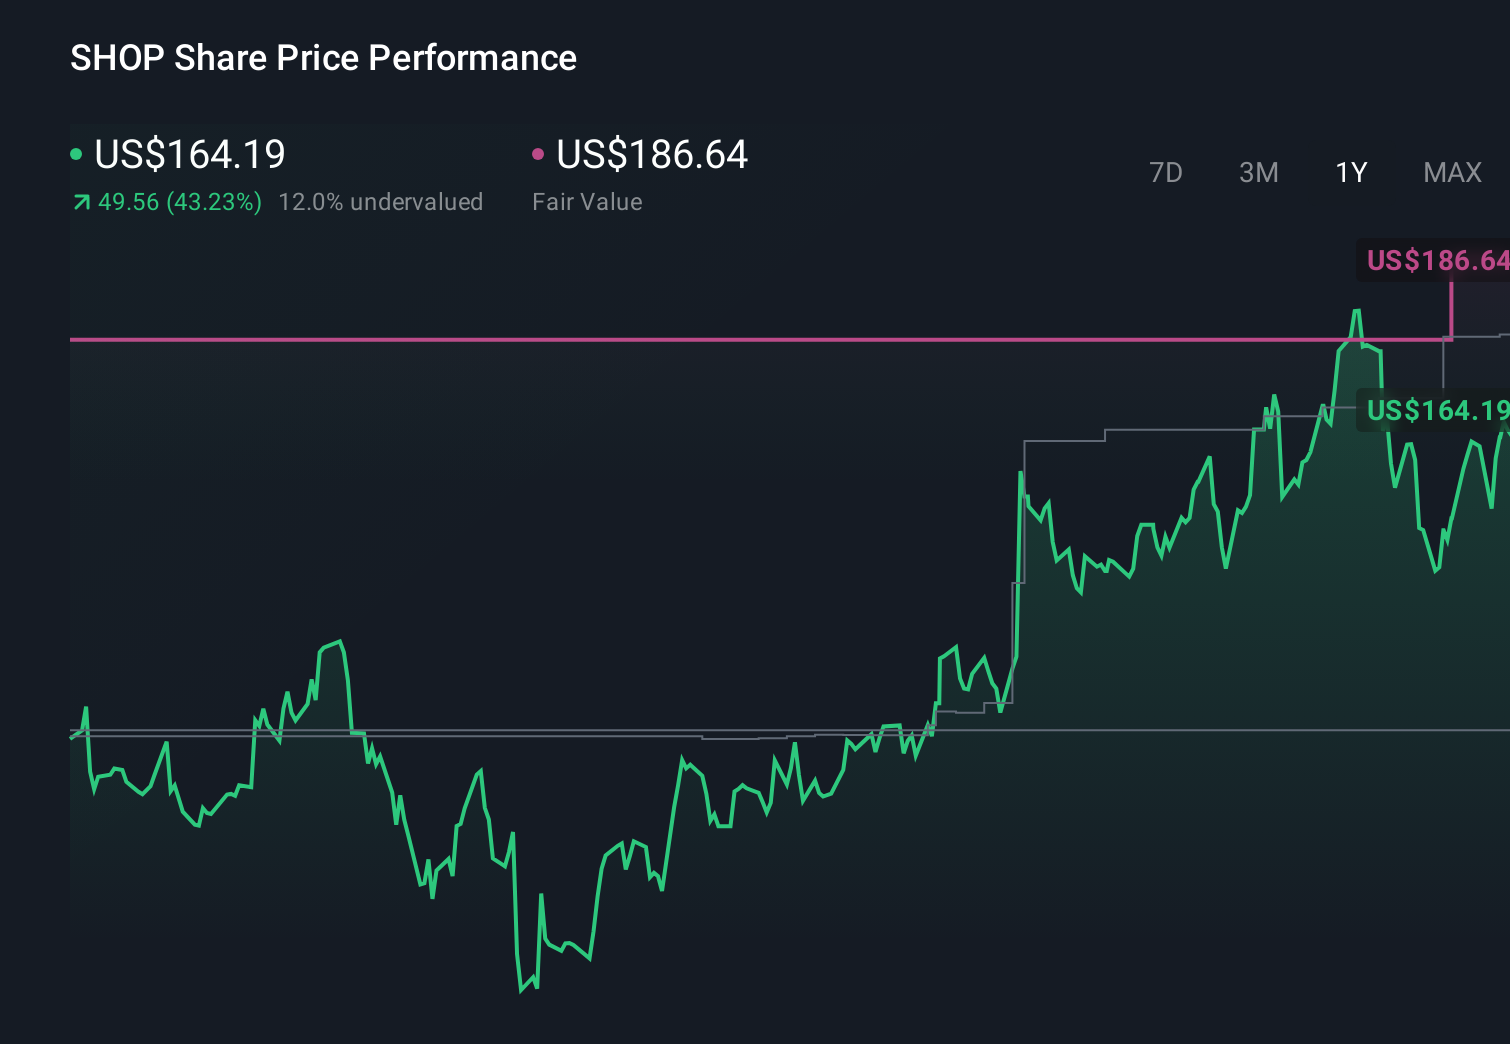
- The stock last closed at US$131.23, with a 4.8% decline over the past week, an 18.5% decline over the past month, a 16.5% decline year to date, a 12.4% gain over the past year, and a 147.9% return over three years, compared to a 1.9% return over five years.
- Recent coverage has focused on Shopify's position as a major e commerce platform provider and how market sentiment has shifted around growth oriented software names generally. This context helps explain why the stock has seen both periods of strong enthusiasm and more cautious trading in recent months.
- Our valuation checks give Shopify a score of 1 out of 6, which suggests there is more to unpack when you look at different valuation methods. Later on, we will also look at a broader way to think about value that goes beyond any single model.
Shopify scores just 1/6 on our valuation checks. See what other red flags we found in the full valuation breakdown.
Approach 1: Shopify Discounted Cash Flow (DCF) Analysis
A Discounted Cash Flow, or DCF, model estimates what a business could be worth today by projecting its future cash flows and then discounting those back into present dollars. It is essentially asking what Shopify's future cash generation is worth to you right now.
For Shopify, the model used is a 2 Stage Free Cash Flow to Equity approach based on cash flow projections. The latest twelve month free cash flow is about $1.89b. Analyst inputs and extrapolated estimates suggest free cash flow reaching about $7.12b in 2030, with a series of annual projections between 2026 and 2035 that Simply Wall St has discounted back to today.
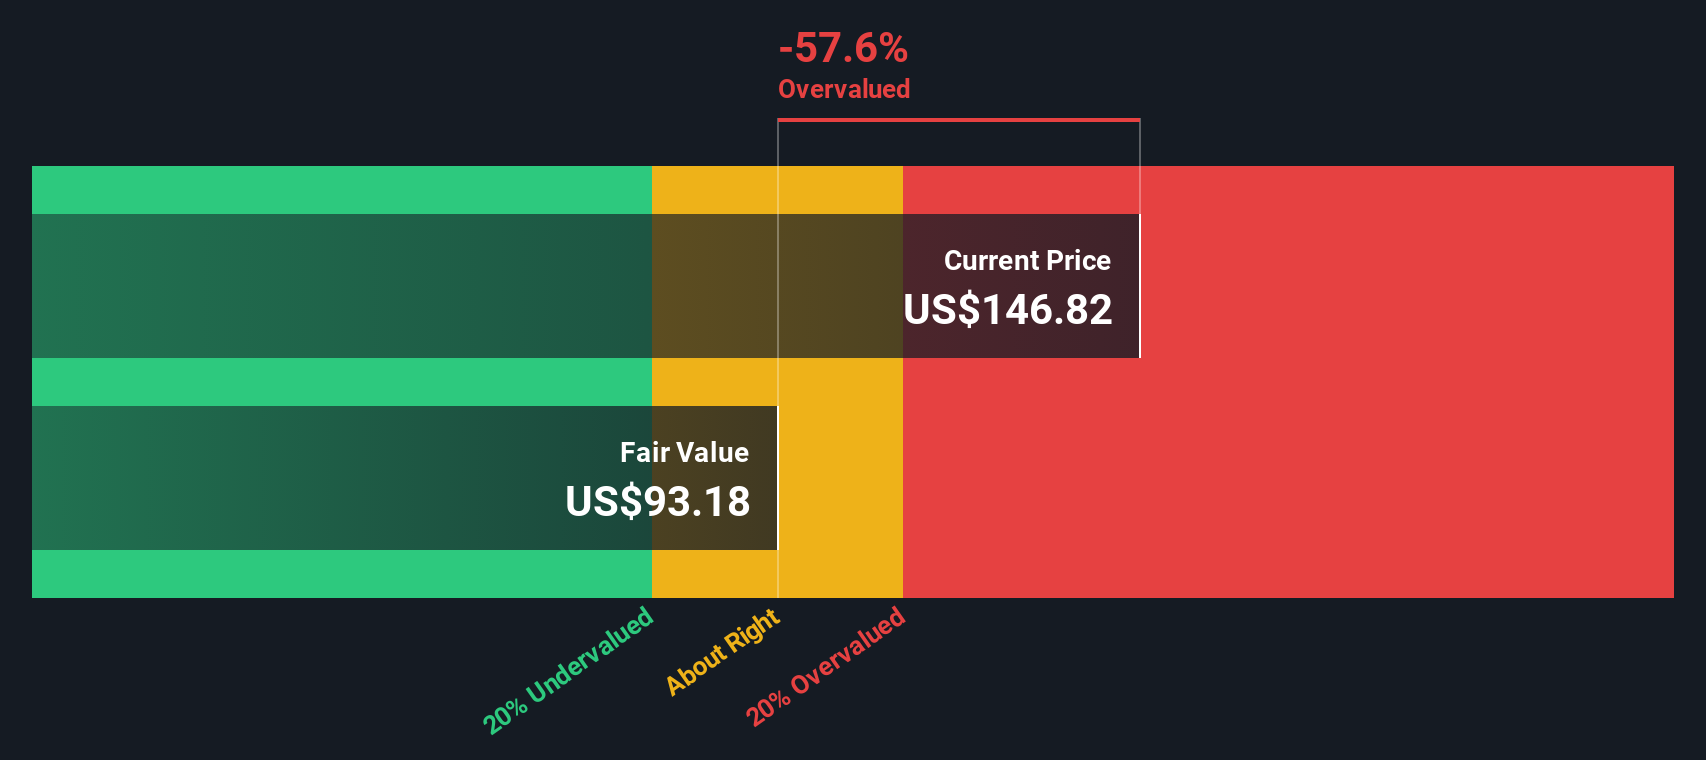
Bringing all those projected cash flows into today's terms leads to an estimated intrinsic value of US$117.54 per share. Against the recent share price of US$131.23, the DCF output points to the stock trading at about an 11.6% premium, which indicates it screens as overvalued on this model.
Result: OVERVALUED
Our Discounted Cash Flow (DCF) analysis suggests Shopify may be overvalued by 11.6%. Discover 868 undervalued stocks or create your own screener to find better value opportunities.
Approach 2: Shopify Price vs Earnings (P/E)
For profitable companies like Shopify, the P/E ratio is a common way to think about value because it links what you pay today to the earnings the business is already generating. In simple terms, a higher P/E can reflect higher growth expectations or lower perceived risk, while a lower P/E can point to more modest growth expectations or higher perceived risk.
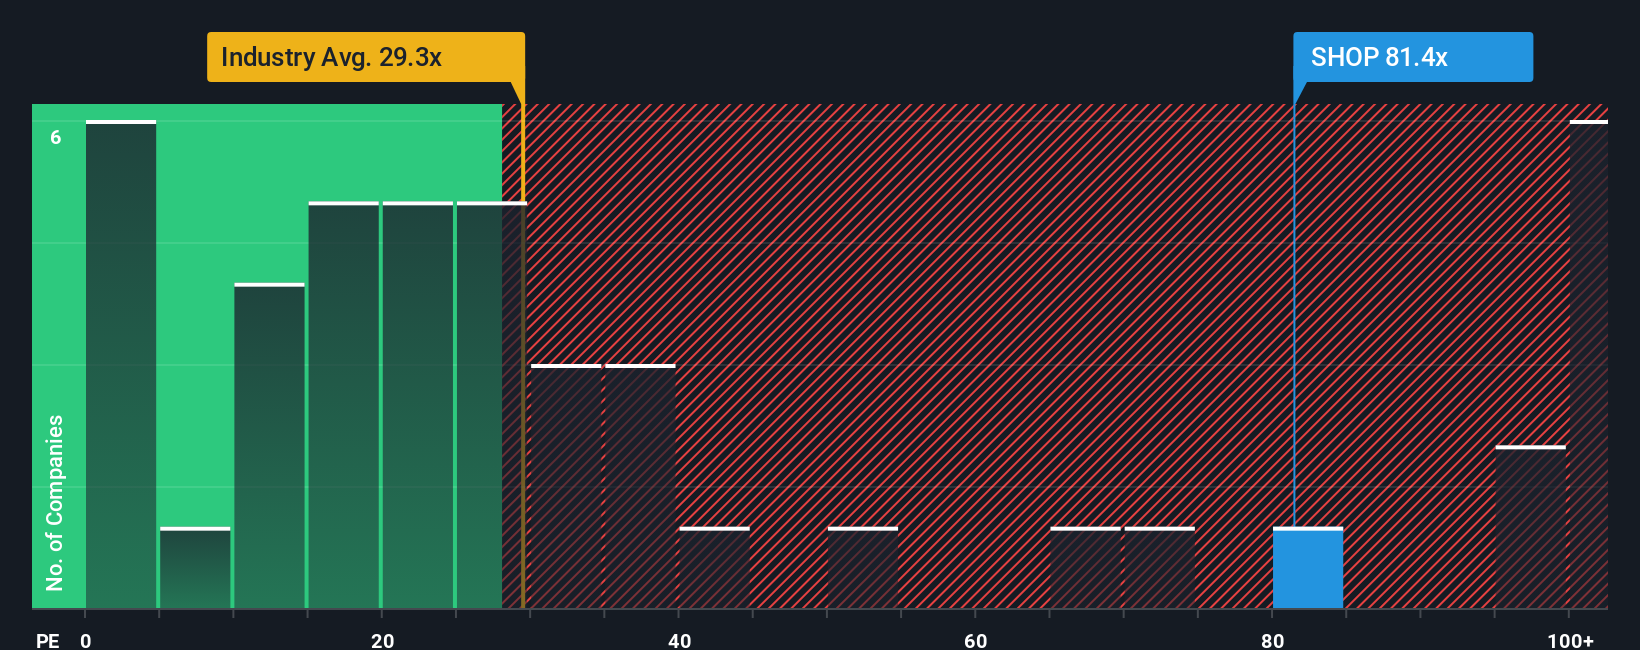
Shopify is currently trading on a P/E of 95.92x. That is well above the IT industry average P/E of 27.57x and also above the peer group average of 37.17x. Simply Wall St also calculates a Fair Ratio of 48.28x, which is the P/E level its model suggests for Shopify after considering factors such as earnings growth, profit margins, industry, market cap and company specific risks.
This Fair Ratio is designed to be more tailored than a simple comparison with peers or the wider industry, because it adjusts for Shopify's own characteristics rather than assuming all IT companies should trade on the same multiple. Comparing the Fair Ratio of 48.28x with the current P/E of 95.92x suggests Shopify shares are pricing in materially higher expectations than the model implies.
Result: OVERVALUED
P/E ratios tell one story, but what if the real opportunity lies elsewhere? Discover 1417 companies where insiders are betting big on explosive growth.
Upgrade Your Decision Making: Choose your Shopify Narrative
Earlier we mentioned that there is an even better way to understand valuation, so let us introduce you to Narratives, which simply means writing the story behind your numbers, such as what you think Shopify can earn, how fast it could grow revenue, and what margins it might achieve.
A Narrative on Simply Wall St connects three things: your view of the company, a financial forecast that reflects that view, and a fair value estimate that falls out of those assumptions.
You can access Narratives on the Community page. There, millions of investors share their views in a format that makes it easy to compare each Narrative fair value to Shopify's current share price and decide whether the gap looks large enough for you to consider your own trading decisions.
Narratives update automatically when new information like earnings or major news is added to the platform, so your story about Shopify and its fair value stays current without you rebuilding a model from scratch. You might see one investor valuing Shopify at US$80 per share while another sees US$180, reflecting very different expectations even when they are using the same tool.
Do you think there's more to the story for Shopify? Head over to our Community to see what others are saying!
This article by Simply Wall St is general in nature. We provide commentary based on historical data and analyst forecasts only using an unbiased methodology and our articles are not intended to be financial advice. It does not constitute a recommendation to buy or sell any stock, and does not take account of your objectives, or your financial situation. We aim to bring you long-term focused analysis driven by fundamental data. Note that our analysis may not factor in the latest price-sensitive company announcements or qualitative material. Simply Wall St has no position in any stocks mentioned.