Is Shopify (SHOP) Still Attractive After A 52.6% One Year Share Price Gain?
Shopify, Inc. Class A SHOP | 118.25 | -0.23% |
- If you are wondering whether Shopify's current share price still offers value or if most of the opportunity is already priced in, you are in the right place.
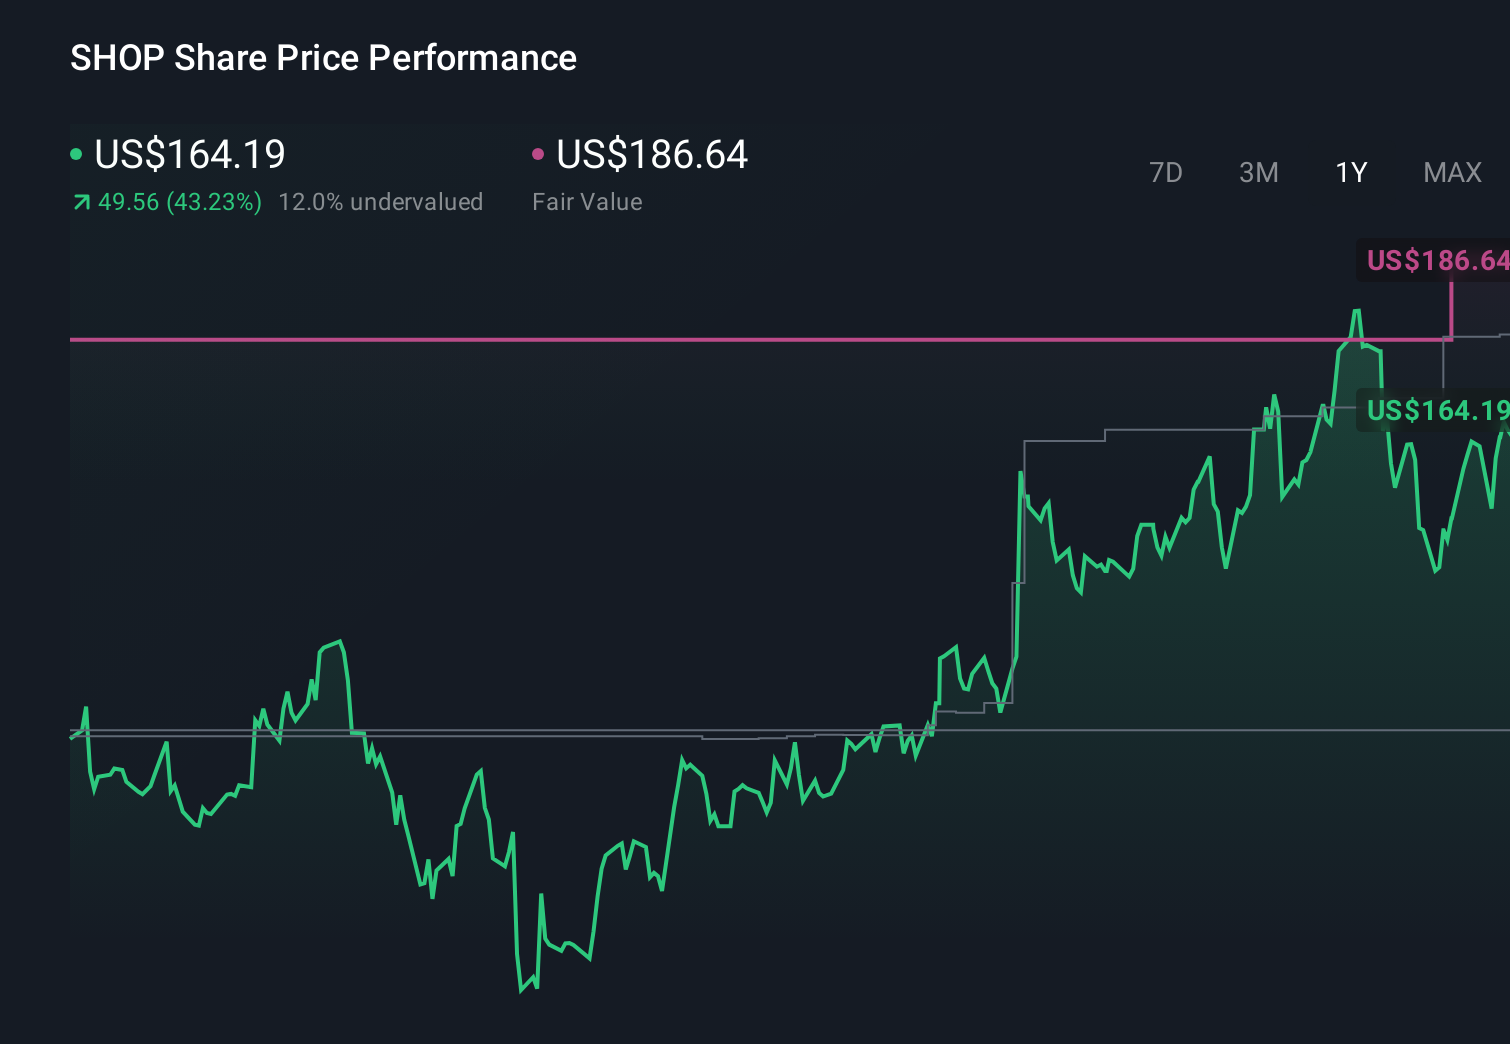
- Shopify recently closed at US$157.99, with a 6.1% decline over 7 days, a 3.2% decline over 30 days, a 0.5% gain year to date, a 52.6% return over 1 year and a 31.9% return over 5 years.
- Recent news coverage has largely focused on Shopify's position as a major e commerce platform provider. There has been particular attention on how merchants use its tools to run online stores and process payments. This context helps frame how investors are thinking about its long term role in online retail and services.
- Our valuation model currently gives Shopify a value score of 0 out of 6. Next we will walk through what that means using several common valuation methods, before finishing with a way of assessing value that can sometimes give a more rounded picture than ratios alone.
Shopify scores just 0/6 on our valuation checks. See what other red flags we found in the full valuation breakdown.
Approach 1: Shopify Discounted Cash Flow (DCF) Analysis
The Discounted Cash Flow, or DCF, model takes estimates of a company’s future cash flows and discounts them back to today using a required rate of return. The goal is to estimate what those future cash flows are worth in today’s dollars.
For Shopify, the model used is a 2 Stage Free Cash Flow to Equity approach, based on cash flow projections expressed in US$. The latest twelve month free cash flow is about US$1.89b. Analysts provide explicit forecasts for several years, and Simply Wall St then extrapolates further, with projected free cash flow reaching US$7.07b in 2030.
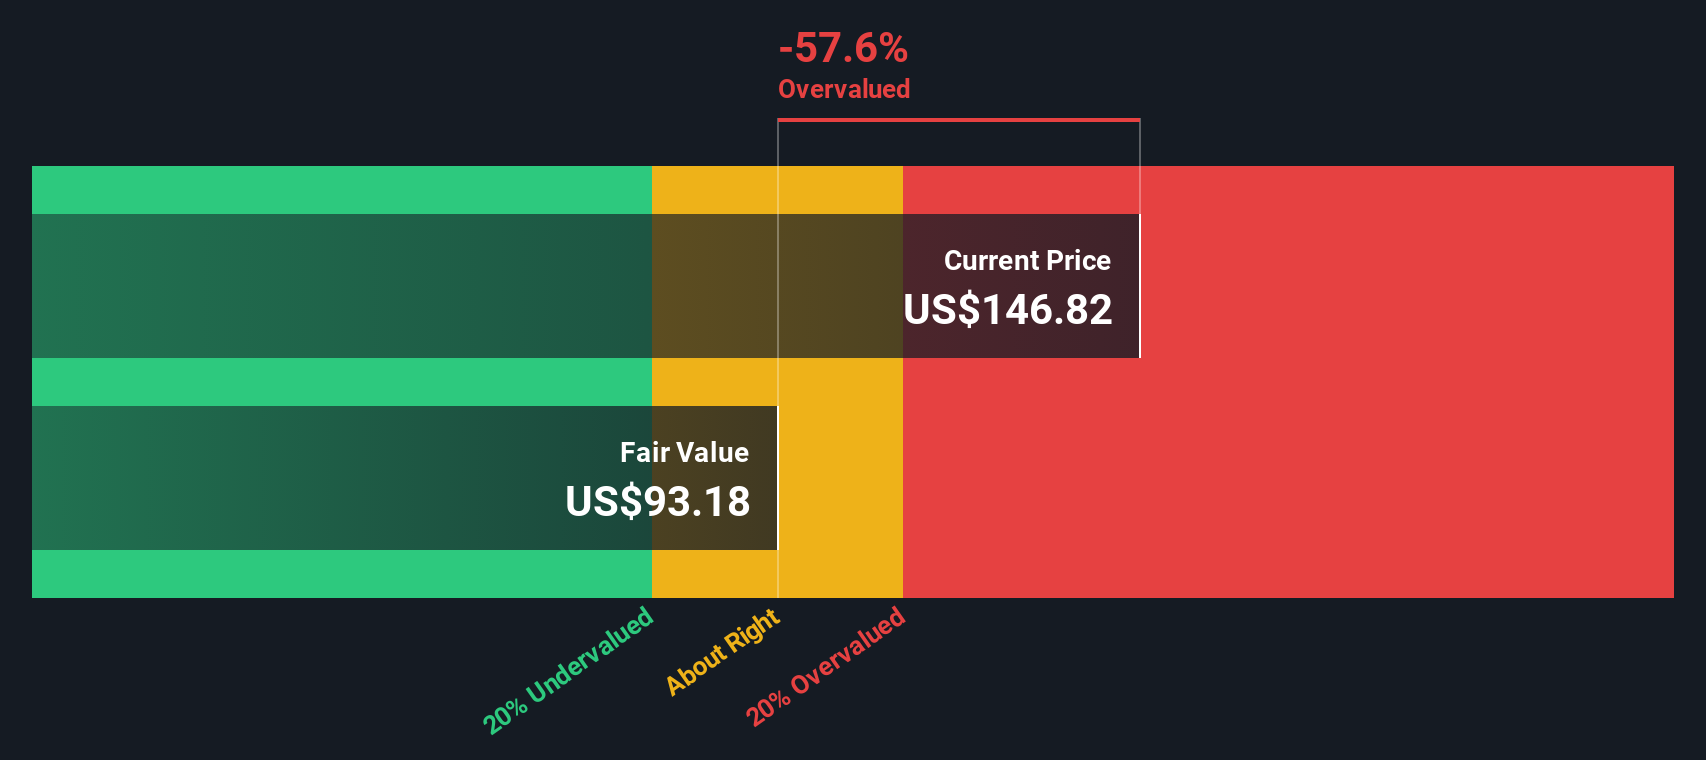
When those projected cash flows from 2026 through 2035 are discounted back and combined, the model arrives at an estimated intrinsic value of US$112.29 per share. Compared with the recent share price of US$157.99, this implies the stock is around 40.7% overvalued on this DCF view.
Result: OVERVALUED
Our Discounted Cash Flow (DCF) analysis suggests Shopify may be overvalued by 40.7%. Discover 870 undervalued stocks or create your own screener to find better value opportunities.
Approach 2: Shopify Price vs Earnings
For profitable companies, the P/E ratio is a useful way to relate what you pay for a share to the earnings that each share currently produces. It helps you see how many years of current earnings the market is effectively capitalizing into the share price.
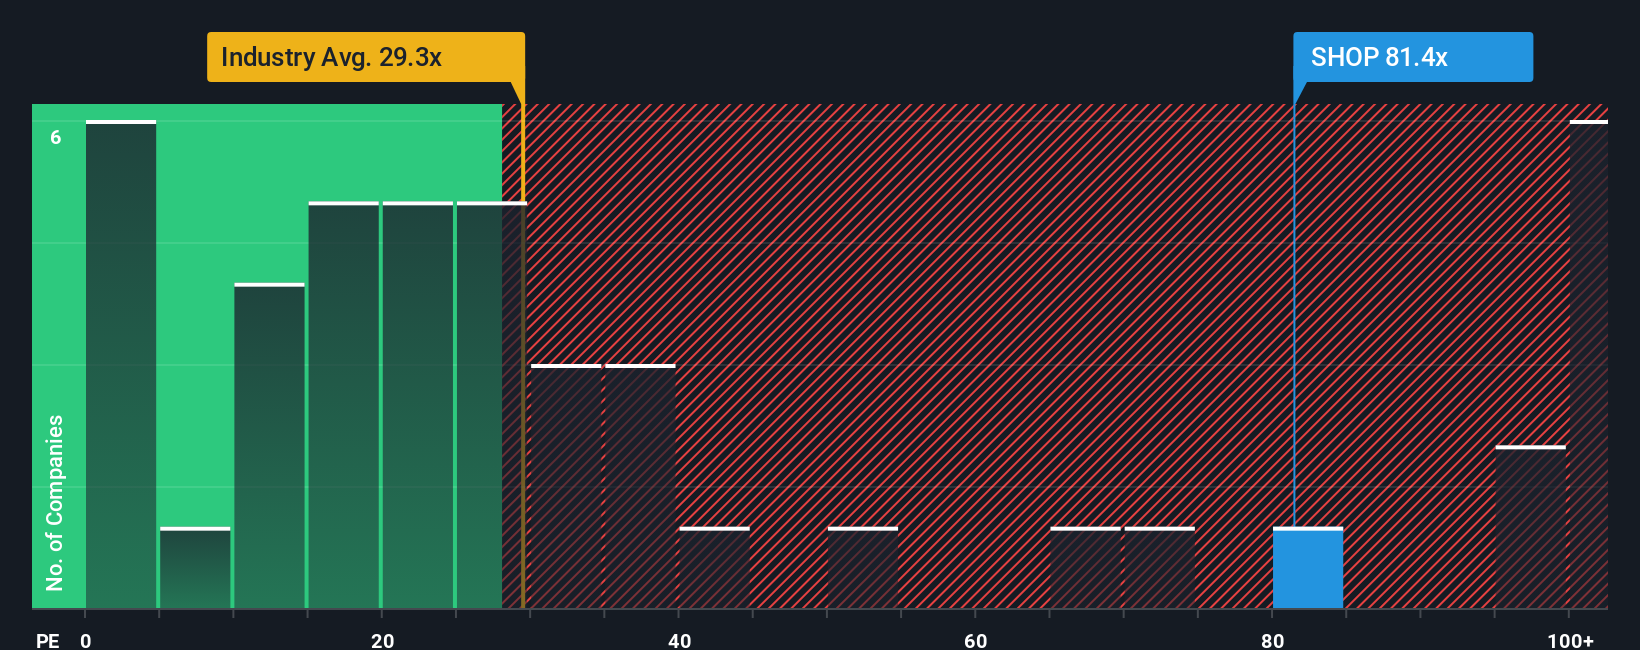
What counts as a “normal” P/E will vary. Higher growth expectations or lower perceived risk tend to justify a higher multiple, while slower growth or higher risk usually point to a lower one. Compared with the IT industry average P/E of 29.80x and a peer group average of 38.90x, Shopify trades on a P/E of 115.48x, which is materially higher than both benchmarks.
Simply Wall St’s Fair Ratio metric for Shopify is 48.98x. This is a proprietary estimate of what P/E could make sense given factors such as Shopify’s earnings growth profile, industry, profit margins, market cap and risk characteristics. Because it blends these company specific inputs, it can often be more tailored than a simple comparison with peers or the broad industry. Setting the Fair Ratio of 48.98x against the current P/E of 115.48x suggests the shares are trading well above that Fair Ratio level.
Result: OVERVALUED
P/E ratios tell one story, but what if the real opportunity lies elsewhere? Discover 1440 companies where insiders are betting big on explosive growth.
Upgrade Your Decision Making: Choose your Shopify Narrative
Earlier we mentioned that there is an even better way to understand valuation. On Simply Wall St you can use Narratives on the Community page, where you and other investors link a clear story about Shopify to specific forecasts for revenue, earnings and margins. These then roll into a fair value that updates as news or earnings arrive. This makes it easier to compare that fair value with the live share price and decide what to do, whether you lean closer to a higher fair value such as about US$200 based on stronger assumptions for AI partnerships and margin expansion, or a lower view such as about US$114 based on more cautious expectations for growth and risk.
Do you think there's more to the story for Shopify? Head over to our Community to see what others are saying!
This article by Simply Wall St is general in nature. We provide commentary based on historical data and analyst forecasts only using an unbiased methodology and our articles are not intended to be financial advice. It does not constitute a recommendation to buy or sell any stock, and does not take account of your objectives, or your financial situation. We aim to bring you long-term focused analysis driven by fundamental data. Note that our analysis may not factor in the latest price-sensitive company announcements or qualitative material. Simply Wall St has no position in any stocks mentioned.