Is Silgan Holdings (SLGN) Quietly Redefining Its Risk Profile With ESOP Equity And Index Exit?
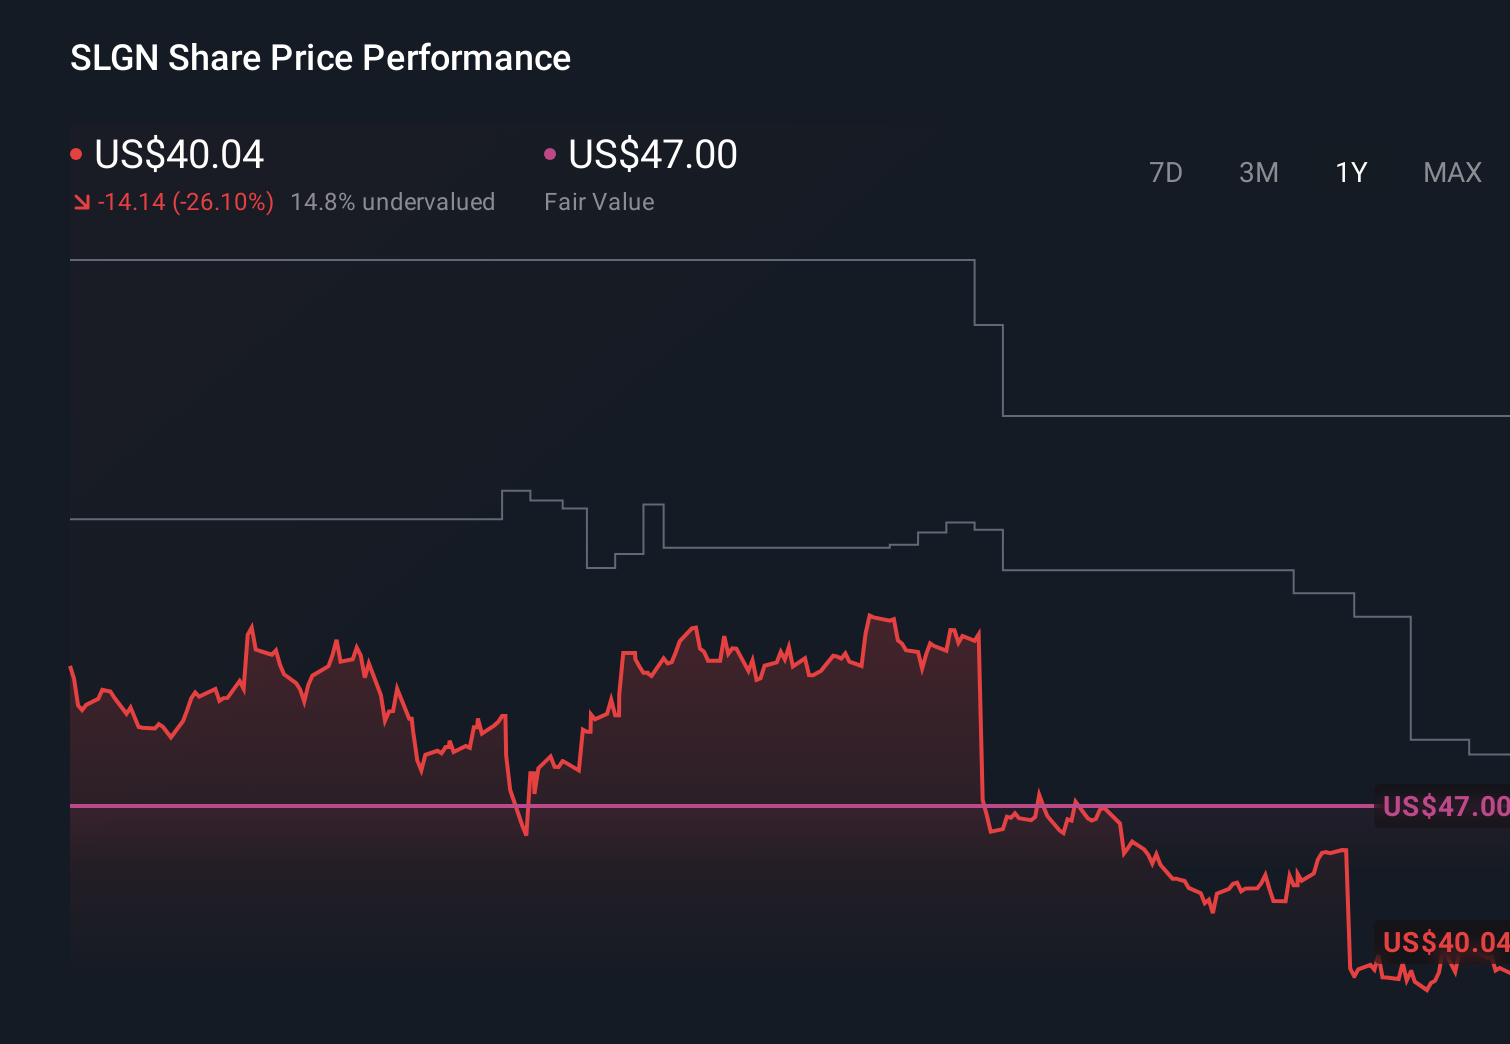
Silgan Holdings Inc. SLGN | 0.00 |
- Silgan Holdings Inc. (NYSE: SLGN) was recently removed from the Russell 1000 Value-Defensive and Russell 1000 Defensive indices and, shortly beforehand, filed a US$181.32 million shelf registration for up to 4,000,000 common shares tied to an ESOP-related offering.
- Together, the index removals and potential equity issuance highlight shifting perceptions of Silgan’s risk profile and capital structure at a time when its core packaging business remains under close investor scrutiny.
- We’ll now examine how Silgan’s index removal, particularly from the Russell 1000 Defensive cohort, interacts with its existing investment narrative and outlook.
The latest GPUs need a type of rare earth metal called Neodymium and there are only 30 companies in the world exploring or producing it. Find the list for free.
Silgan Holdings Investment Narrative Recap
To own Silgan, you need to believe its cash generative packaging franchises can offset pressure on legacy formats and customer concentration while funding disciplined capital allocation. The Russell index removals and ESOP related shelf registration do not appear to alter the near term focus on defending margins and managing debt, but they sharpen attention on the biggest current risk: how Silgan balances shareholder returns with a balance sheet that is not yet fully cushioned by operating cash flow.
The new US$181.32 million shelf registration for up to 4,000,000 common shares tied to an ESOP sits alongside Silgan’s existing US$500 million buyback authorization, underlining how active the company is in managing its share count. For investors watching short term catalysts such as earnings progression and dividend capacity, this mix of potential issuance and repurchases adds another layer to monitor around per share outcomes and the overall capital structure.
Yet, against this backdrop, investors should still pay close attention to the risk that rising capital intensity and higher funding needs could quietly reshape Silgan’s financial flexibility...
Silgan Holdings' narrative projects $7.3 billion revenue and $439.0 million earnings by 2029.
Uncover how Silgan Holdings' forecasts yield a $53.17 fair value, a 15% upside to its current price.
Exploring Other Perspectives
While consensus focuses on balance sheet strain and index removal, the most optimistic analysts previously expected revenue near US$7.3 billion and earnings around US$480.9 million, highlighting how views on packaging demand and debt funded growth can differ sharply and may shift again after this news.
Explore 3 other fair value estimates on Silgan Holdings - why the stock might be worth just $46.51!
Decide For Yourself
Don't just follow the ticker - dig into the data and build a conviction that's truly your own.
- A great starting point for your Silgan Holdings research is our analysis highlighting 3 key rewards and 1 important warning sign that could impact your investment decision.
- Our free Silgan Holdings research report provides a comprehensive fundamental analysis summarized in a single visual - the Snowflake - making it easy to evaluate Silgan Holdings' overall financial health at a glance.
Seeking Other Investments?
Right now could be the best entry point. These picks are fresh from our daily scans. Don't delay:
- We've uncovered the 8 dividend fortresses yielding 5%+ that don't just survive market storms, but thrive in them.
- The future of work is here. Discover the 29 top robotics and automation stocks leading the charge in AI-driven automation and industrial transformation.
- This technology could replace computers: discover 30 stocks that are working to make quantum computing a reality.
This article by Simply Wall St is general in nature. We provide commentary based on historical data and analyst forecasts only using an unbiased methodology and our articles are not intended to be financial advice. It does not constitute a recommendation to buy or sell any stock, and does not take account of your objectives, or your financial situation. We aim to bring you long-term focused analysis driven by fundamental data. Note that our analysis may not factor in the latest price-sensitive company announcements or qualitative material. Simply Wall St has no position in any stocks mentioned.