Is SM Energy (SM) Offering An Opportunity After A 56.9% One Year Share Price Decline
SM Energy Company SM | 30.62 | +3.80% |
- If you are wondering whether SM Energy is a bargain or a value trap at its recent price around US$18.17, you are asking the right question.
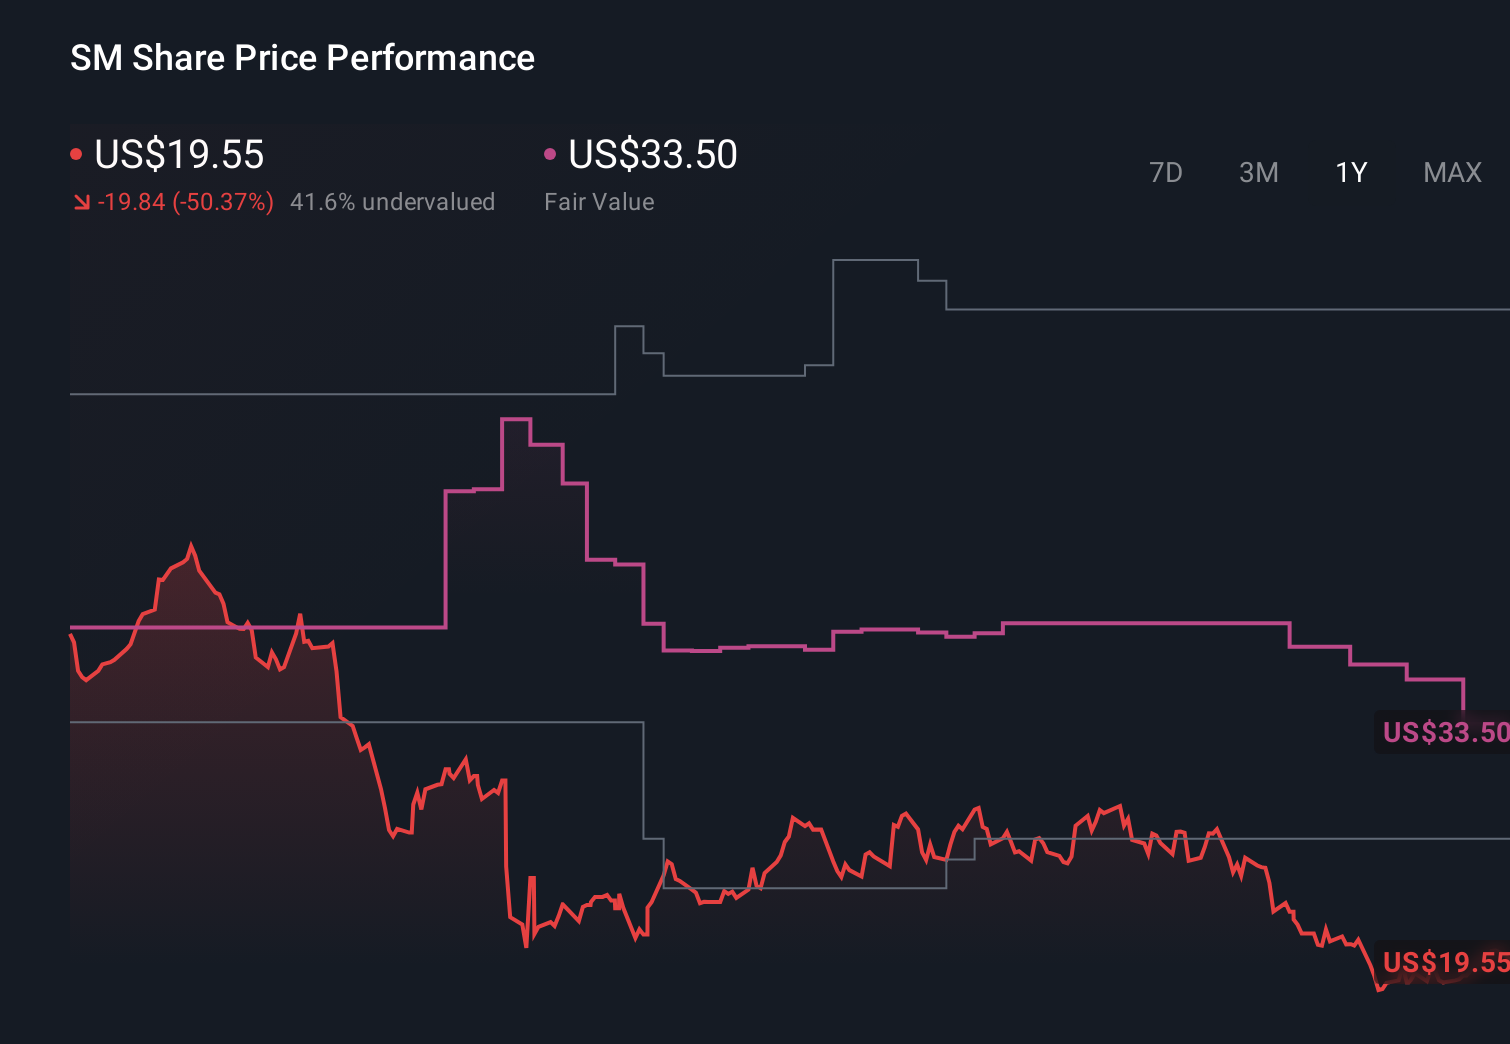
- The stock has had a tough run, with a 7.1% decline over the last 30 days, a 5.0% drop year to date, and a 56.9% fall over the past year, even though the 5 year return sits at 124.6%.
- Recent moves in SM Energy have come against a backdrop of ongoing attention on US oil and gas producers, sector wide capital discipline, and investor focus on balance sheet resilience and shareholder returns. These themes help frame why a stock with a mixed return profile can still attract value focused investors who are looking closely at fundamentals.
- On Simply Wall St's 6 point valuation checklist, SM Energy scores a 5 out of 6, suggesting several metrics flag the shares as potentially undervalued. Next, we will look at how different valuation methods treat the stock, before finishing with a more complete way to think about what "value" really means here.
Approach 1: SM Energy Discounted Cash Flow (DCF) Analysis
A Discounted Cash Flow model takes projected future cash flows and then discounts them back to today using a required return to estimate what the entire business might be worth per share right now.
For SM Energy, the latest twelve month free cash flow is a loss of $307.4 million, so the model leans heavily on future expectations. Analysts provide free cash flow estimates out to 2028, and Simply Wall St extends these figures to build a 10 year path. Within that window, projected annual free cash flow ranges from about $1,324.5 million in 2026 to $1,855.5 million in 2035, with $1,720 million in 2028. All of these are expressed in dollars and discounted back using a 2 Stage Free Cash Flow to Equity approach.
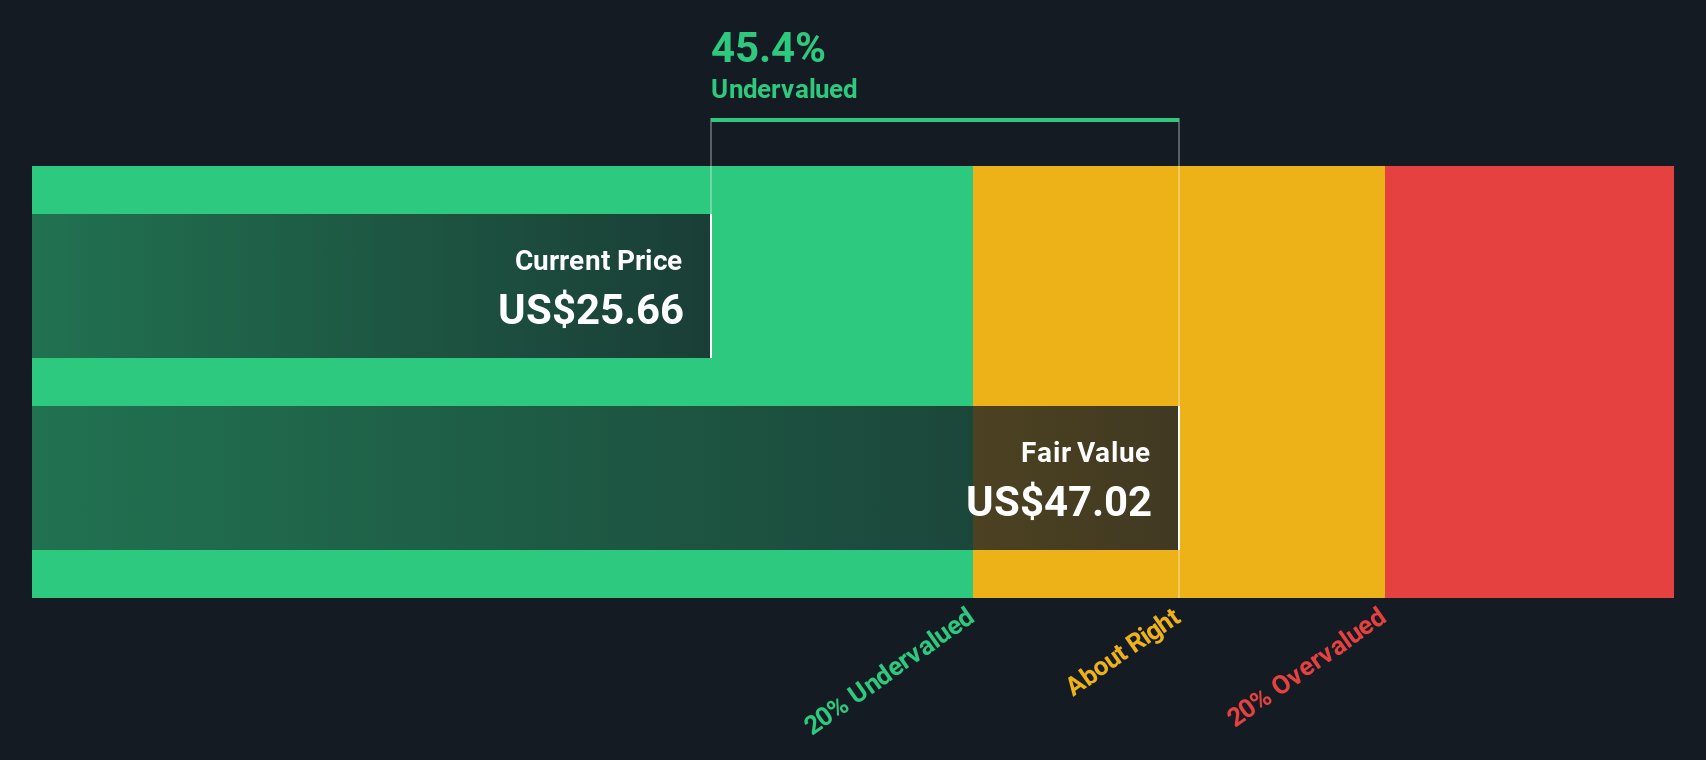
Putting these cash flows together produces an estimated intrinsic value of $252.40 per share. Relative to the recent share price around $18.17, the model implies the stock is 92.8% undervalued.
Result: UNDERVALUED
Our Discounted Cash Flow (DCF) analysis suggests SM Energy is undervalued by 92.8%. Track this in your watchlist or portfolio, or discover 883 more undervalued stocks based on cash flows.
Approach 2: SM Energy Price vs Earnings
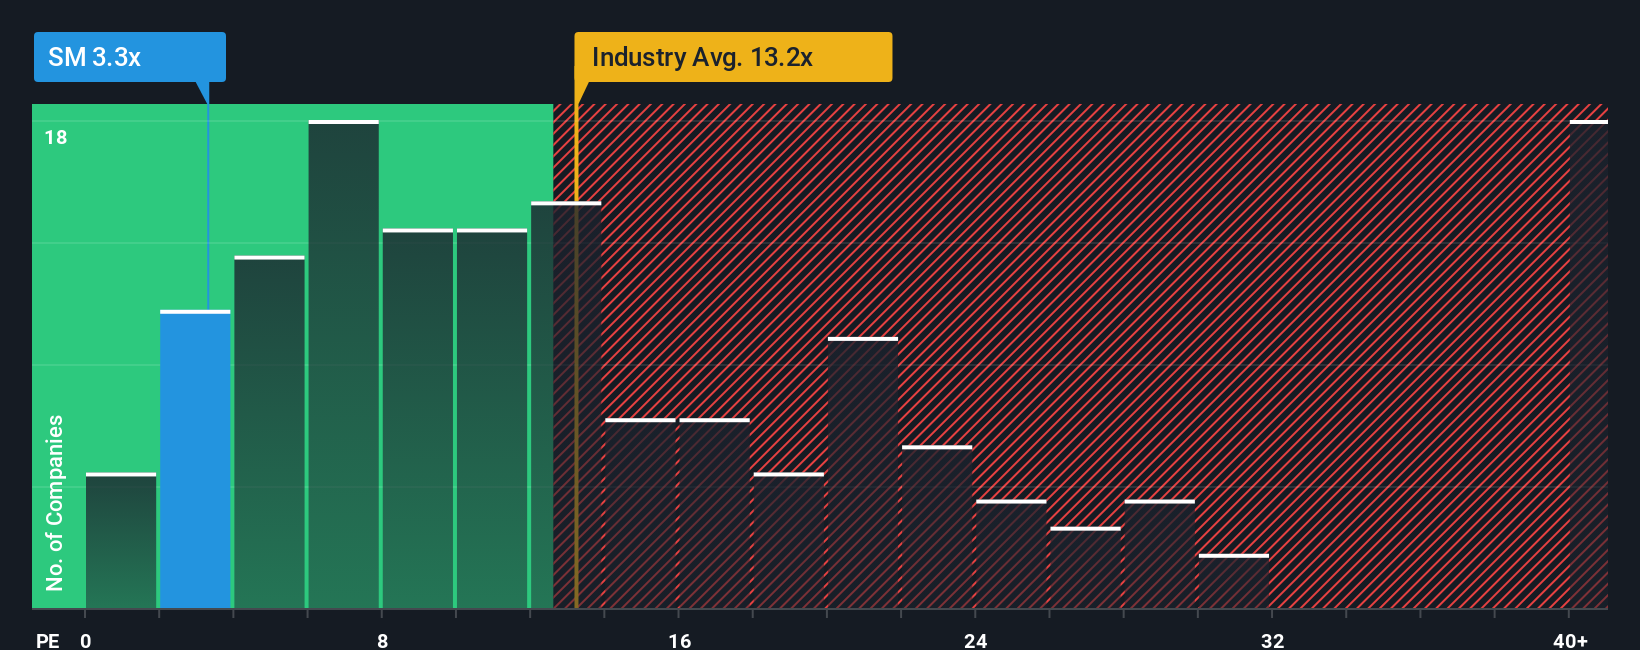
For a profitable company, the P/E ratio is a useful way to think about what you are paying for each dollar of earnings, which is why it is the preferred multiple here. A higher P/E usually reflects higher growth expectations or lower perceived risk, while a lower P/E often aligns with more modest growth expectations or higher perceived risk.
SM Energy currently trades on a P/E of 2.86x. That sits well below the Oil and Gas industry average P/E of 13.51x and the peer group average of 36.64x. On the surface, that kind of gap suggests the market is assigning a lower valuation to SM Energy’s earnings than to many of its industry peers.
Simply Wall St’s Fair Ratio for SM Energy is 16.39x. This is a proprietary estimate of what a more normal P/E might look like for the company, based on factors such as its earnings growth profile, industry, profit margin, market capitalization and risk characteristics. Because it is tailored to the company rather than just comparing with broad industry or peer averages, the Fair Ratio can give a more specific sense of what investors might usually pay for these earnings. With the Fair Ratio at 16.39x and the current P/E at 2.86x, the shares screen as undervalued on this metric.
Result: UNDERVALUED
P/E ratios tell one story, but what if the real opportunity lies elsewhere? Discover 1442 companies where insiders are betting big on explosive growth.
Upgrade Your Decision Making: Choose your SM Energy Narrative
Earlier we mentioned that there is an even better way to understand valuation. On Simply Wall St you can use Narratives on the Community page to connect your view of SM Energy’s story directly to your own revenue, earnings and margin forecasts. For example, you can consider whether share repurchases and production guidance support potential shareholder upside, or whether concentration in a few shale regions and energy transition risks weigh more heavily. You can then see how your view flows into a fair value, compare that to the current price, and watch your view update automatically as new news, guidance or analyst targets are reflected in the data, such as the current fair value estimate of about US$32.33 with bullish targets up to US$59 and cautious views down to US$27.
Do you think there's more to the story for SM Energy? Head over to our Community to see what others are saying!
This article by Simply Wall St is general in nature. We provide commentary based on historical data and analyst forecasts only using an unbiased methodology and our articles are not intended to be financial advice. It does not constitute a recommendation to buy or sell any stock, and does not take account of your objectives, or your financial situation. We aim to bring you long-term focused analysis driven by fundamental data. Note that our analysis may not factor in the latest price-sensitive company announcements or qualitative material. Simply Wall St has no position in any stocks mentioned.