Is Snap’s Valuation Fair After Augmented Reality and Ad Platform News?
Snap SNAP | 4.60 | +14.43% |
If you’re debating whether to buy, hold, or move on from Snap stock, you’re definitely not alone. Even the savviest investors can find Snap a bit of a puzzle. After all, in just the past week Snap shares bounced up by 3.9%, but step back to the past month and you’ll see the price actually slipped 3.3%. Glance even further back, such as a year or more, and the ride gets a lot bumpier, with the stock down about 24% over twelve months and more than 79% in five years. That’s a mix of short-term hope and long-term frustration, leaving a lot of people scratching their heads about the next move.
One reason for those sharp swings is the news cycle. Lately, Snap has been in the spotlight for its efforts to refocus on its core social platform, roll out new augmented reality features, and build better ad tools for marketers. These shifts suggest management is keenly aware of what’s not working and is willing to act, something Wall Street tends to reward with renewed optimism, at least in the short term. But, as these initiatives are still in early days, the market seems divided on whether this is truly a turning point.
That is where Snap’s valuation score comes in. Out of the six different valuation checks we use, Snap earns a solid 4, meaning it appears undervalued by most standards but not across the board. So how does that actually stack up, and why does Snap keep drawing attention even after such a rough long-term ride? Let’s dive into the numbers, and stick around, because there is an even sharper way to think about valuation that could tip the scales in your favor.
Approach 1: Snap Discounted Cash Flow (DCF) Analysis
A Discounted Cash Flow (DCF) model estimates a company's intrinsic value by projecting its expected future cash flows and then discounting those amounts back to today's dollars. This approach is designed to answer the question: what is Snap really worth, based on the cash it is expected to generate in the future?
For Snap, the DCF analysis starts with its latest reported Free Cash Flow, which stands at approximately $365 million. Analyst estimates project steady growth, with Free Cash Flow expected to reach about $1.43 billion by the end of 2029. While detailed analyst forecasts typically extend only five years, further growth projections beyond that point are extrapolated using a standard methodology.
After crunching the numbers, the DCF model assigns Snap an estimated intrinsic value of $18.95 per share. Compared to its current trading price, this suggests the stock is trading at a 58.1% discount, indicating it is substantially undervalued by this measure.
Result: UNDERVALUED
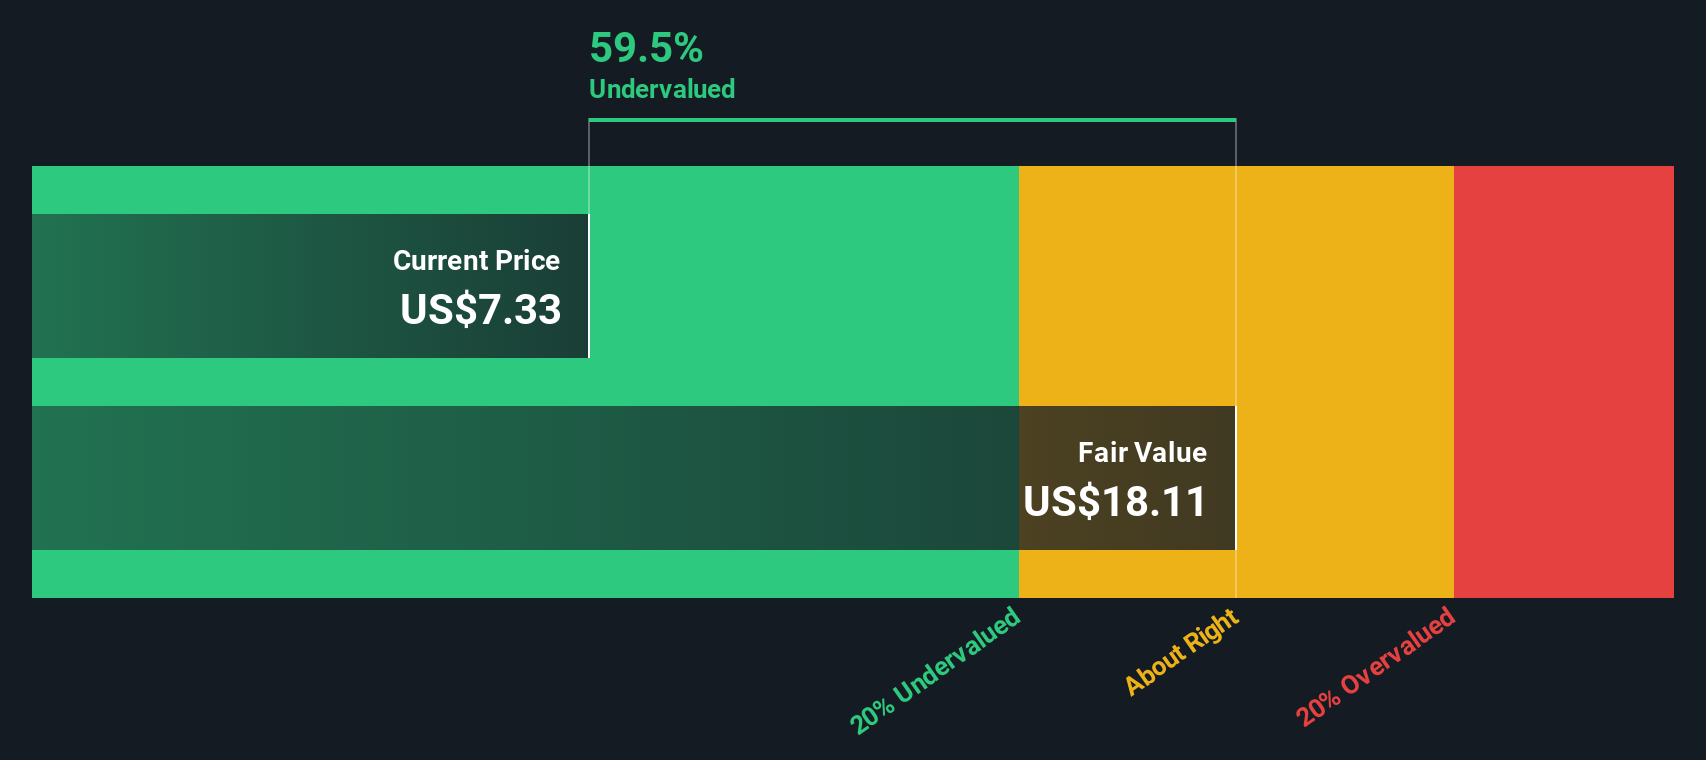
Our Discounted Cash Flow (DCF) analysis suggests Snap is undervalued by 58.1%. Track this in your watchlist or portfolio, or discover more undervalued stocks.
Approach 2: Snap Price vs Sales (P/S)
For companies like Snap that are still finding consistent profitability, the Price-to-Sales (P/S) ratio is an especially handy tool. This ratio measures the value the market places on each dollar of Snap’s sales, which is particularly relevant for growing technology companies that reinvest to fuel expansion rather than post big profits today.
Growth prospects and risk levels both impact what a "normal" or "fair" P/S ratio should be. Rapid revenue growth, a defensible business model, and consistent execution can justify higher ratios. The more future growth investors expect, the more they are usually willing to pay for each dollar of today’s sales, provided the risks seem manageable.
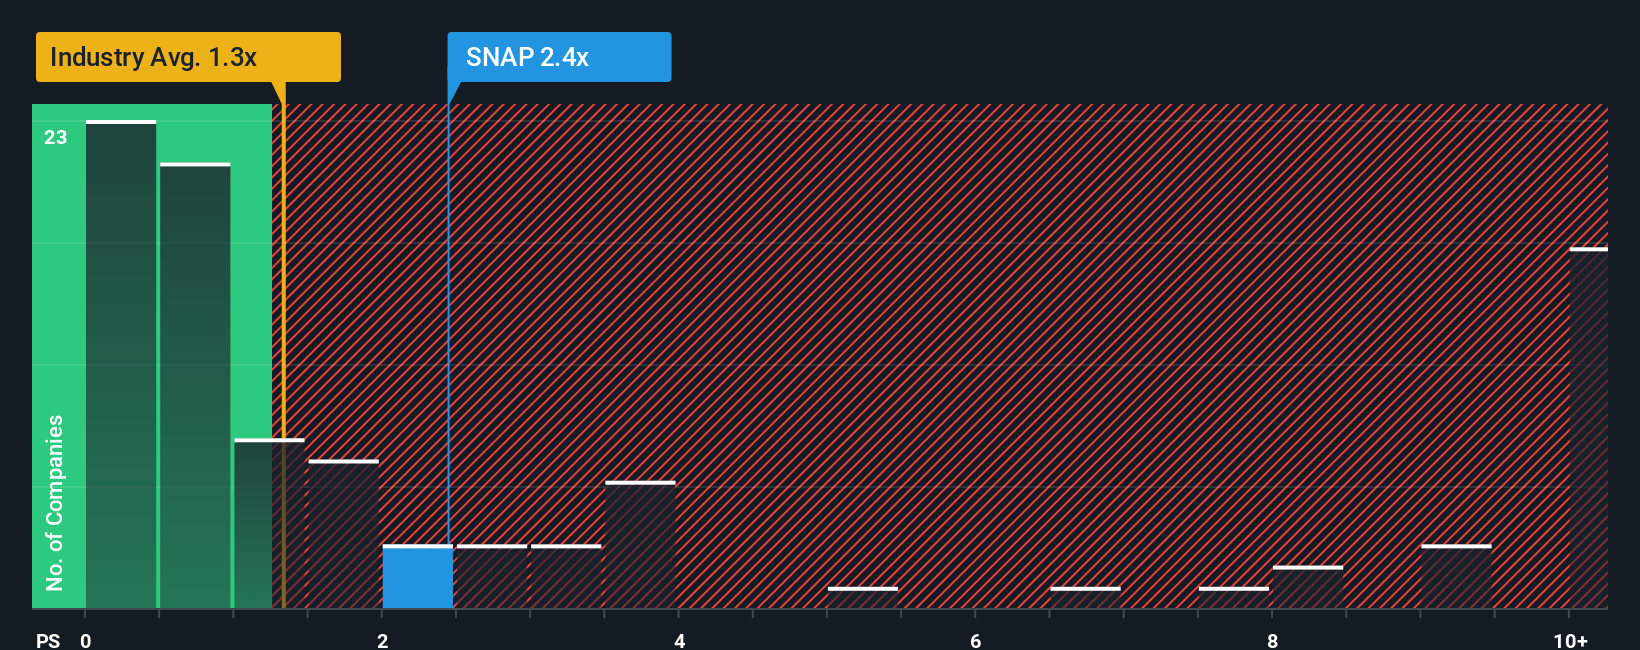
Right now, Snap trades at a P/S ratio of 2.38x. This is above the Interactive Media and Services industry average of 1.37x, but below the peer group average of 3.35x. To provide a more nuanced view, Simply Wall St calculates a proprietary Fair Ratio for Snap at 2.72x. This Fair Ratio goes a step further than generic industry or peer comparisons by factoring in Snap’s earnings growth potential, unique business risks, market cap, and profit margin. As a result, it offers a tailored benchmark for what seems reasonable for Snap, rather than a one-size-fits-all yardstick.
Comparing Snap’s actual P/S of 2.38x with its Fair Ratio of 2.72x, the difference is less than 0.10. This suggests the market is valuing Snap about right when you take company-specific factors into account.
Result: ABOUT RIGHT
PS ratios tell one story, but what if the real opportunity lies elsewhere? Discover companies where insiders are betting big on explosive growth.
Upgrade Your Decision Making: Choose your Snap Narrative
Earlier we mentioned that there is an even better way to understand valuation, so let's introduce you to Narratives. A Narrative is simply the story you believe about a company's future, connecting your perspective on where Snap is headed with the financial forecasts and fair value you expect. Instead of just comparing numbers, Narratives help you link Snap's business developments (like AR innovation or new revenue streams) to what those could mean for future earnings, margins, and ultimately, what the stock is really worth.
With Narratives, you create your own scenario by entering estimates for things like Snap's future revenue growth and profit margin. The tool then translates that narrative into a fair value, which can be compared to today's price so you can decide if Snap looks like a bargain or a pass. These Narratives live on Simply Wall St's Community page, where millions of investors can view or build their own, and are automatically updated whenever new information, such as financial results or major news, comes in.
For example, some Snap Narratives forecast a fair value of $16 based on bullish assumptions about AR-fueled ad growth, while others are much more cautious and set fair value as low as $7, factoring in regulatory risks and competition. No matter your view, Narratives put the numbers back in your hands, making investment decisions more transparent, relevant, and dynamic.
Do you think there's more to the story for Snap? Create your own Narrative to let the Community know!

This article by Simply Wall St is general in nature. We provide commentary based on historical data and analyst forecasts only using an unbiased methodology and our articles are not intended to be financial advice. It does not constitute a recommendation to buy or sell any stock, and does not take account of your objectives, or your financial situation. We aim to bring you long-term focused analysis driven by fundamental data. Note that our analysis may not factor in the latest price-sensitive company announcements or qualitative material. Simply Wall St has no position in any stocks mentioned.