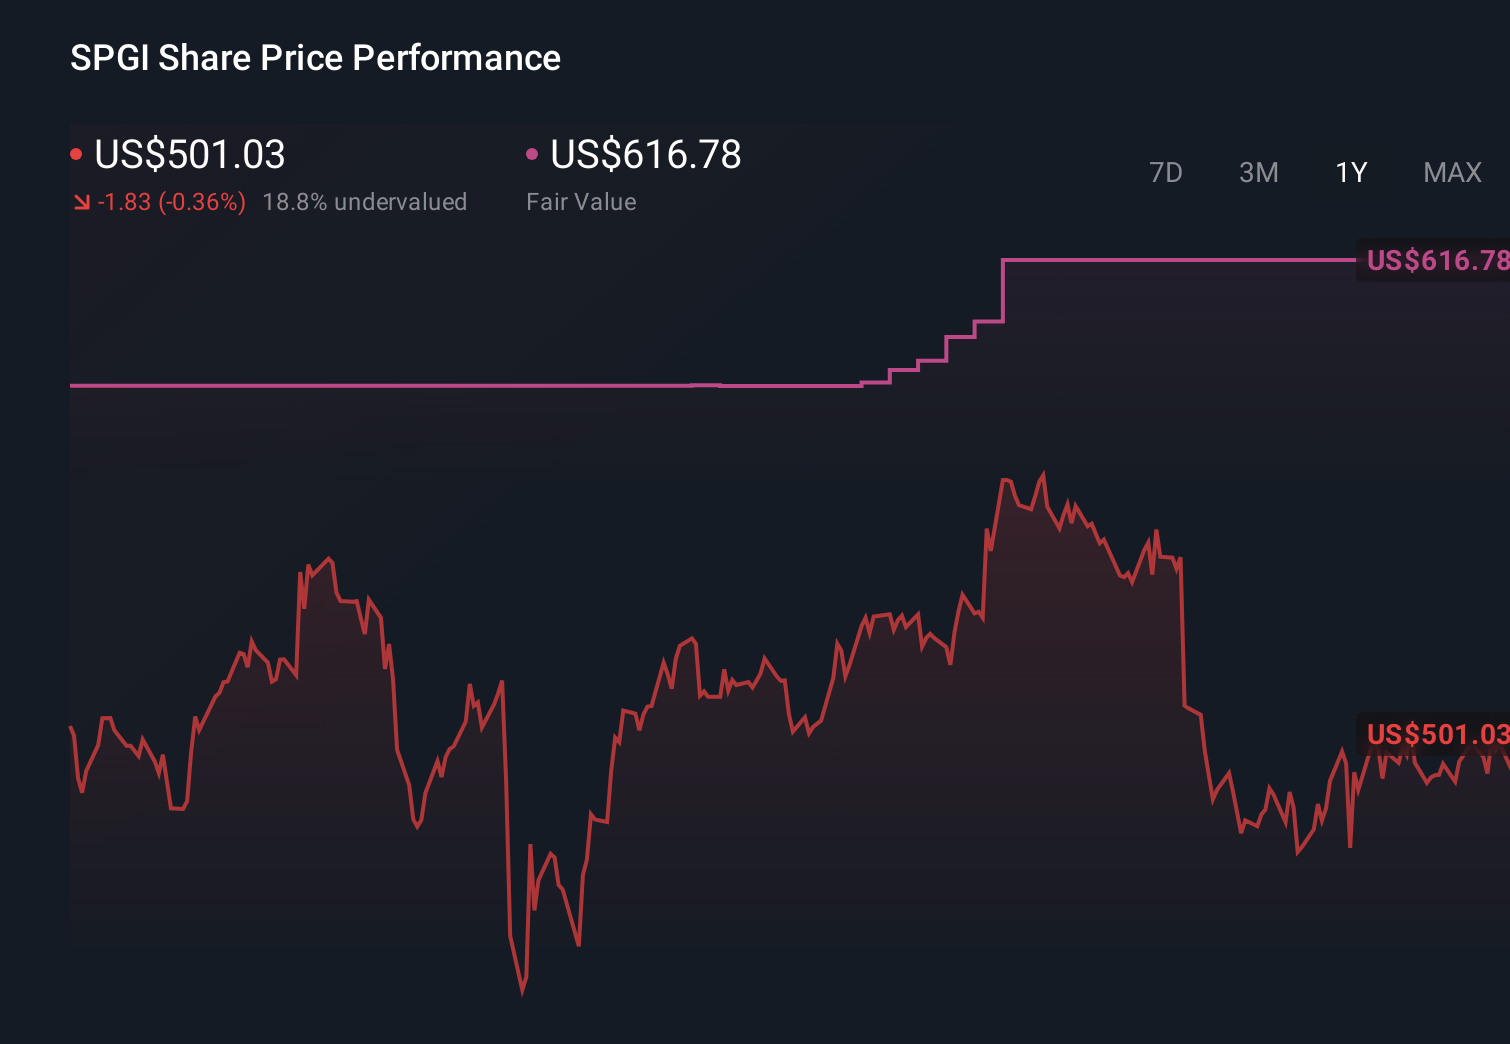
Is S&P Global (SPGI) Pricing Look Stretched After Recent 18.9% Monthly Share Price Decline
S&P Global, Inc. SPGI | 430.58 | +1.26% |
- Wondering if S&P Global's share price around US$439.28 now reflects a fair deal or an overreaction? This article walks through what the numbers are really saying about value.
- The stock has seen a 16.8% decline over the last 7 days and an 18.9% decline over the past month, while the 3 year and 5 year returns sit at 23.8% and 34.9% respectively.
- Recent coverage has focused on S&P Global's role as a key data and analytics provider across credit ratings, indices, and financial intelligence. This helps frame how investors think about shifts in its share price. There has also been attention on how its broad service mix positions it across different parts of global capital markets, which can influence sentiment when prices move quickly.
- Simply Wall St currently gives S&P Global a valuation score of 1 out of 6. Next we will look at what each of the main valuation approaches suggests, before finishing with a more holistic way to think about what the stock might be worth to you.
S&P Global scores just 1/6 on our valuation checks. See what other red flags we found in the full valuation breakdown.
Approach 1: S&P Global Excess Returns Analysis
The Excess Returns model asks a simple question: is S&P Global earning more on shareholders' equity than it is expected to, after accounting for the cost of that equity? The gap between those two figures is the "excess return" that is capitalised into an intrinsic value per share.
For S&P Global, book value is estimated at $109.21 per share, rising to a stable book value of $115.18 per share. Stable EPS is put at $20.82 per share, based on weighted future Return on Equity estimates from 4 analysts, with an average Return on Equity of 18.08%. The cost of equity is estimated at $9.26 per share, which implies an excess return of $11.56 per share on the equity base.
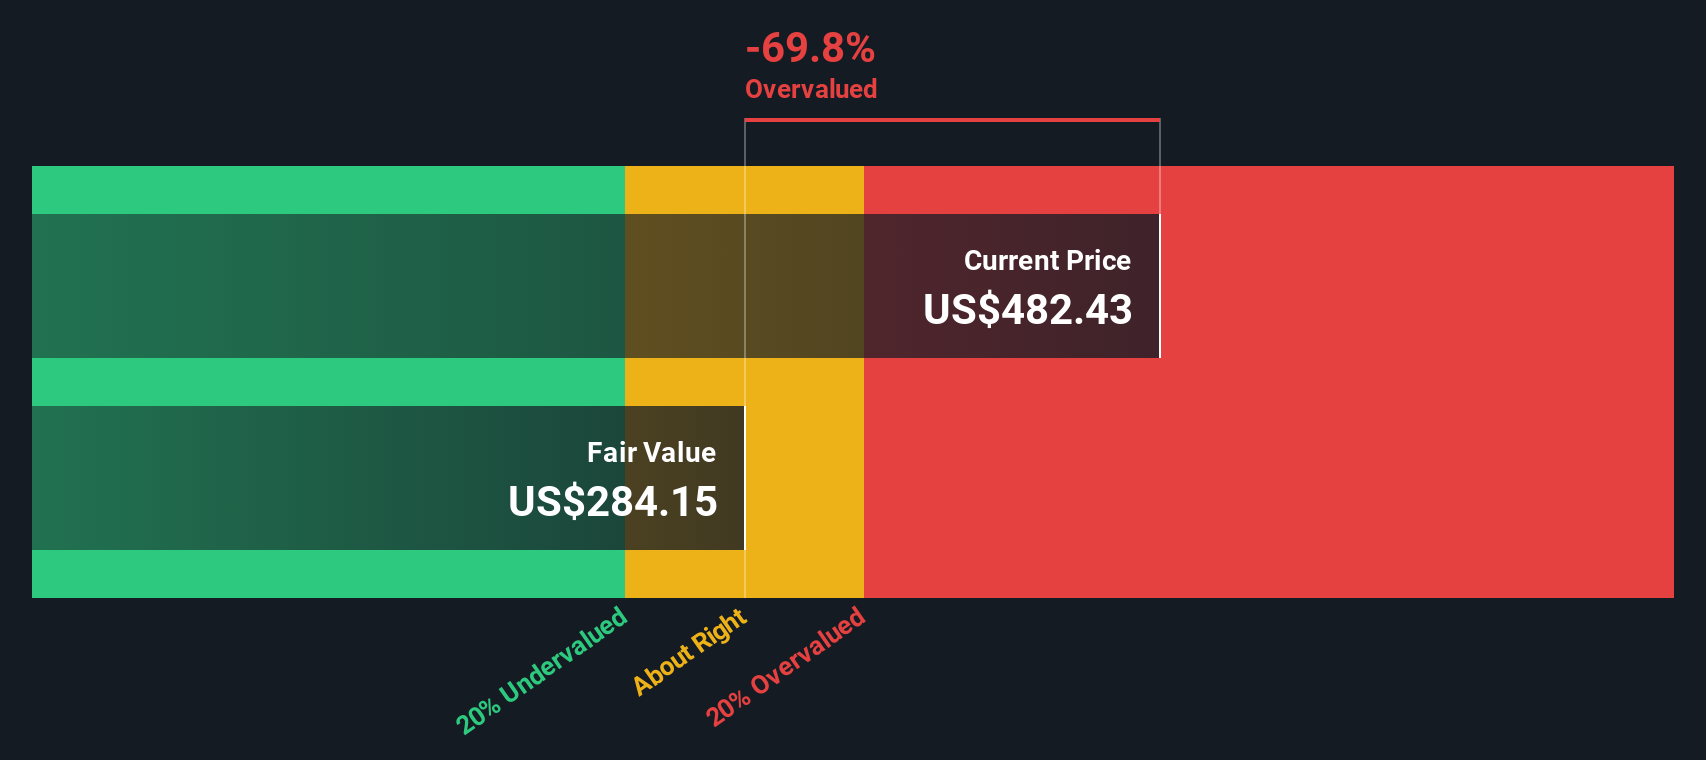
When these excess returns are projected forward and discounted, the model suggests an intrinsic value of about $364.92 per share. Against a current share price around $439.28, the Excess Returns valuation implies the stock is roughly 20.4% overvalued on this framework.
Result: OVERVALUED
Our Excess Returns analysis suggests S&P Global may be overvalued by 20.4%. Discover 52 high quality undervalued stocks or create your own screener to find better value opportunities.
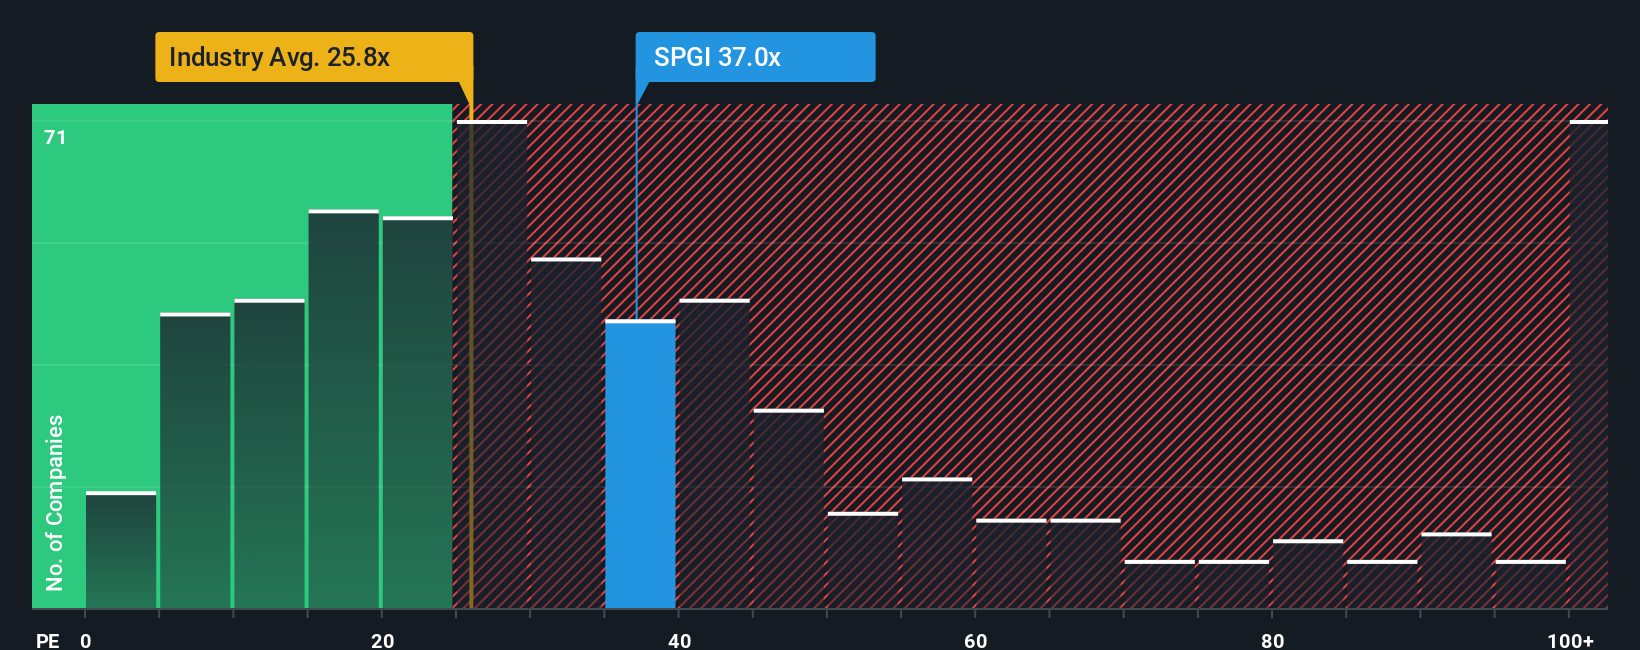
Approach 2: S&P Global Price vs Earnings
P/E is a common way to think about value for profitable companies because it ties what you pay directly to the earnings each share is generating. Put simply, a higher P/E usually reflects higher growth expectations or a perception of lower risk, while a lower P/E can point to lower growth expectations or higher risk.
S&P Global currently trades on a P/E of 31.54x. That sits above both the Capital Markets industry average P/E of 23.26x and a peer group average of 29.78x, which suggests the market is willing to pay a higher price for each dollar of the company’s earnings compared with many of its listed peers.
Simply Wall St also provides a Fair Ratio of 18.93x for S&P Global. This is a proprietary estimate of what a more tailored P/E might look like after considering factors such as earnings growth, profit margins, industry, market cap and company specific risks. Because it blends these elements, it can be more informative than a simple comparison with peer or industry averages. Comparing the current 31.54x P/E with the 18.93x Fair Ratio indicates that the shares are trading above that Fair Ratio level.
Result: OVERVALUED
P/E ratios tell one story, but what if the real opportunity lies elsewhere? Start investing in legacies, not executives. Discover our 22 top founder-led companies.
Upgrade Your Decision Making: Choose your S&P Global Narrative
Earlier we mentioned that there is an even better way to understand valuation, so let us introduce you to Narratives, a simple way to connect your view of S&P Global’s future with the numbers that sit behind a fair value estimate.
A Narrative is your story for the company, where you spell out what you expect for revenue, earnings and margins, then link that story to a financial forecast and, ultimately, to a fair value per share.
On Simply Wall St’s Community page, millions of investors use Narratives as an accessible tool to compare their Fair Value with the current share price. This can help them decide whether S&P Global looks attractive, fairly priced or expensive based on their own assumptions.
Because Narratives update when new information like earnings releases or major news arrives, you can quickly see how fresh data affects your forecast and fair value. One S&P Global Narrative might assume strong earnings growth and a higher fair value, while another might assume more cautious revenue and margin estimates and arrive at a much lower figure.
Do you think there's more to the story for S&P Global? Head over to our Community to see what others are saying!
This article by Simply Wall St is general in nature. We provide commentary based on historical data and analyst forecasts only using an unbiased methodology and our articles are not intended to be financial advice. It does not constitute a recommendation to buy or sell any stock, and does not take account of your objectives, or your financial situation. We aim to bring you long-term focused analysis driven by fundamental data. Note that our analysis may not factor in the latest price-sensitive company announcements or qualitative material. Simply Wall St has no position in any stocks mentioned.