Is Stryker (SYK) Pricing In Too Much Optimism After Recent Share Price Weakness?
Stryker Corporation SYK | 331.54 | +0.65% |
- If you are wondering whether Stryker's current share price fairly reflects its long term potential, you are not alone. This article is here to unpack that question in a structured way.
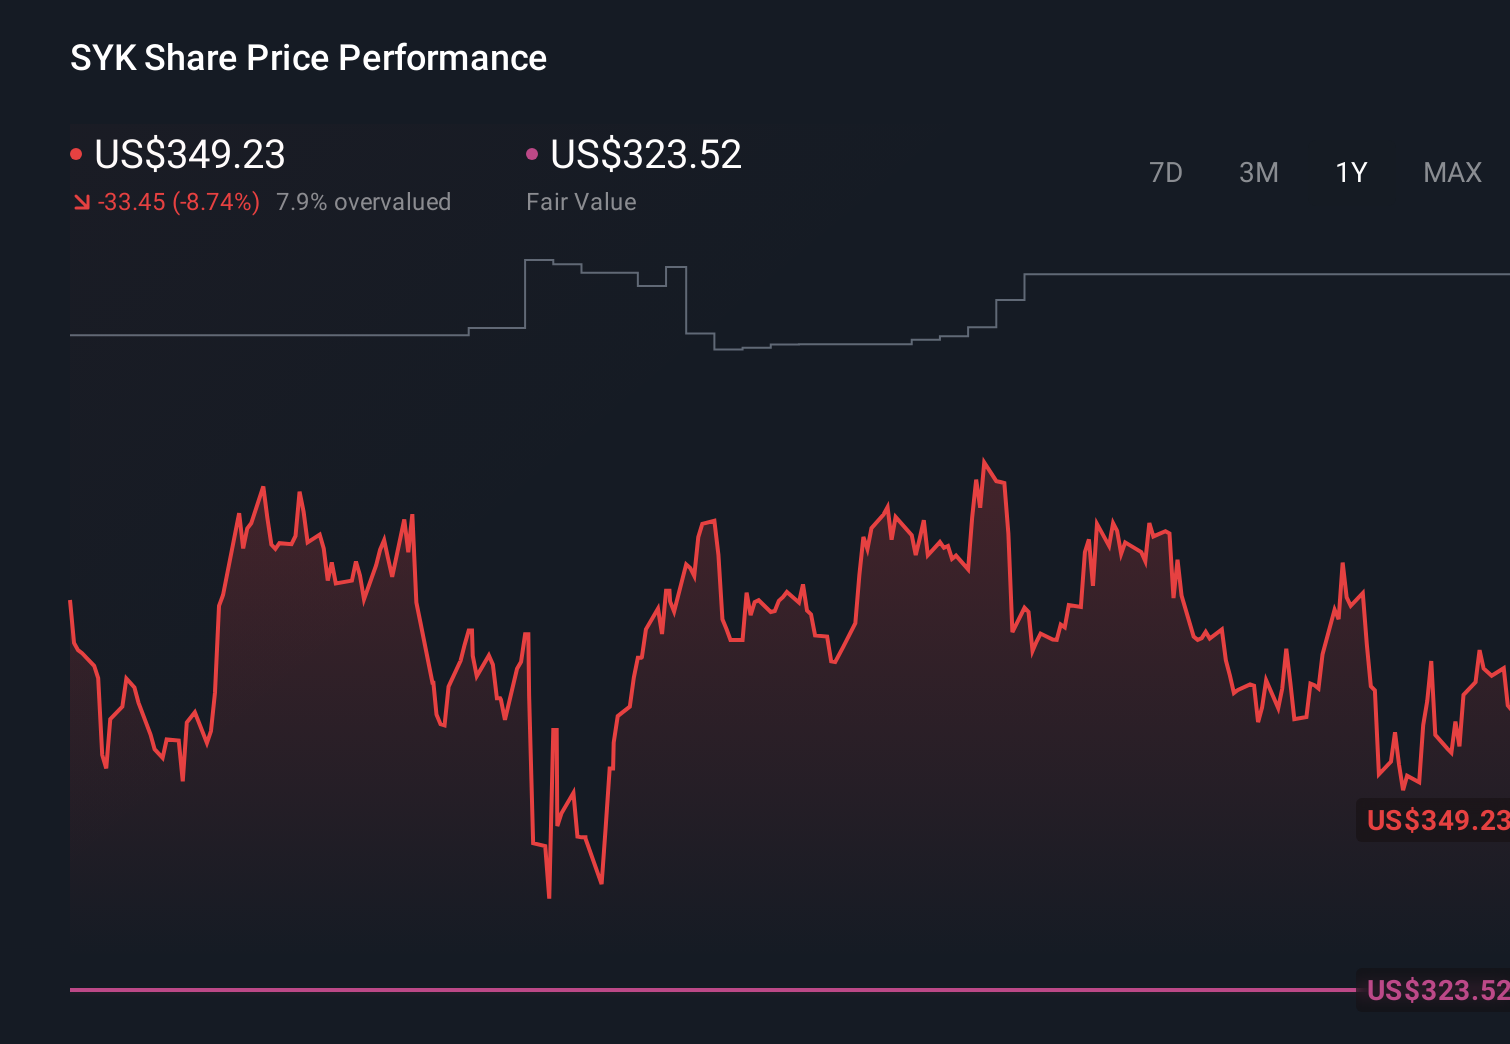
- The stock closed at US$355.04, with returns of 2.0% year to date, a 9.1% decline over the last year, but gains of 43.8% over three years and 69.1% over five years. This gives a mixed picture of recent performance and perceived risk.
- Recent coverage around Stryker has focused on its position as a major medical technology company and how investors are weighing its long term role in healthcare against current pricing. This context helps explain why the share price has seen short term weakness alongside stronger multi year returns, as investors reassess what they are willing to pay.
- On our valuation checklist, Stryker scores 1 out of 6. This means it screens as undervalued on only one of the six methods we use. Next we will compare those valuation approaches and later look at an even more informative way to think about what the stock might be worth.
Stryker scores just 1/6 on our valuation checks. See what other red flags we found in the full valuation breakdown.
Approach 1: Stryker Discounted Cash Flow (DCF) Analysis
A Discounted Cash Flow (DCF) model takes the cash Stryker is expected to generate in the future and then discounts those projected cash flows back to today to estimate what the business might be worth right now.
Stryker’s latest twelve month Free Cash Flow is about $4.09b. Using a 2 Stage Free Cash Flow to Equity model built on cash flow projections, analyst estimates and extrapolations point to Free Cash Flow of $5.90b by 2028, with further forecasts out to 2035 based on Simply Wall St estimates. All figures are in $ and are treated in Billions where they are above $1b.
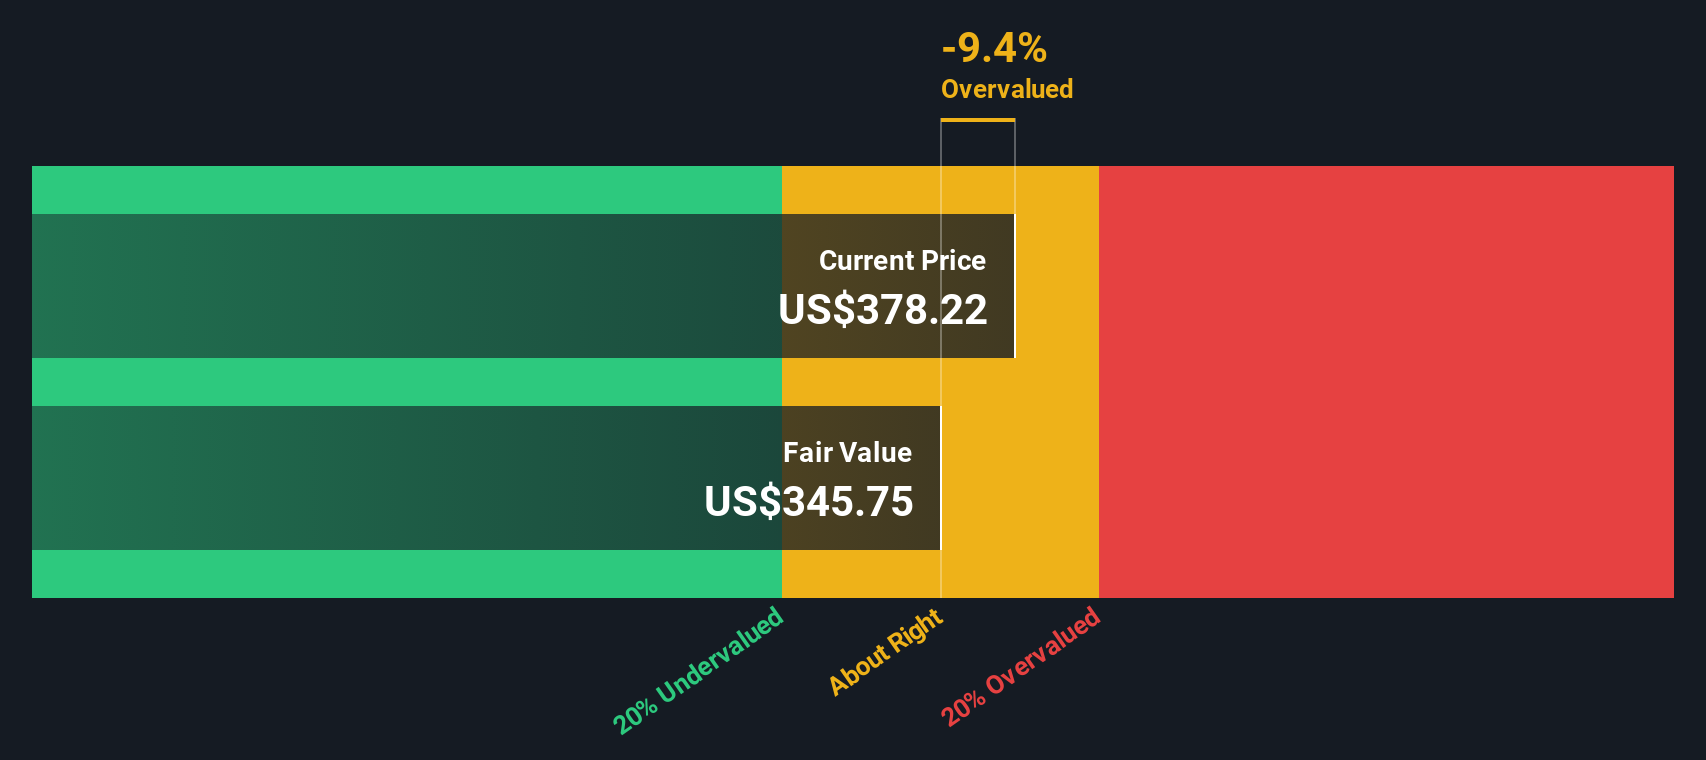
When all these future cash flows are discounted back to today, the model arrives at an estimated intrinsic value of about $298.65 per share. Compared with the current share price of $355.04, this DCF view suggests Stryker trades at roughly an 18.9% premium, which screens as overvalued on this approach alone.
Result: OVERVALUED
Our Discounted Cash Flow (DCF) analysis suggests Stryker may be overvalued by 18.9%. Discover 862 undervalued stocks or create your own screener to find better value opportunities.
Approach 2: Stryker Price vs Earnings
For a profitable company like Stryker, the P/E ratio is a useful way to relate what you pay per share to the earnings the business is currently generating. It gives you a quick sense of how many dollars investors are willing to pay for each dollar of earnings.
What counts as a "normal" or "fair" P/E depends on how the market views a company’s growth outlook and risk profile. Higher expected growth or lower perceived risk often support higher P/E multiples, while slower growth or higher risk usually point to lower ones.
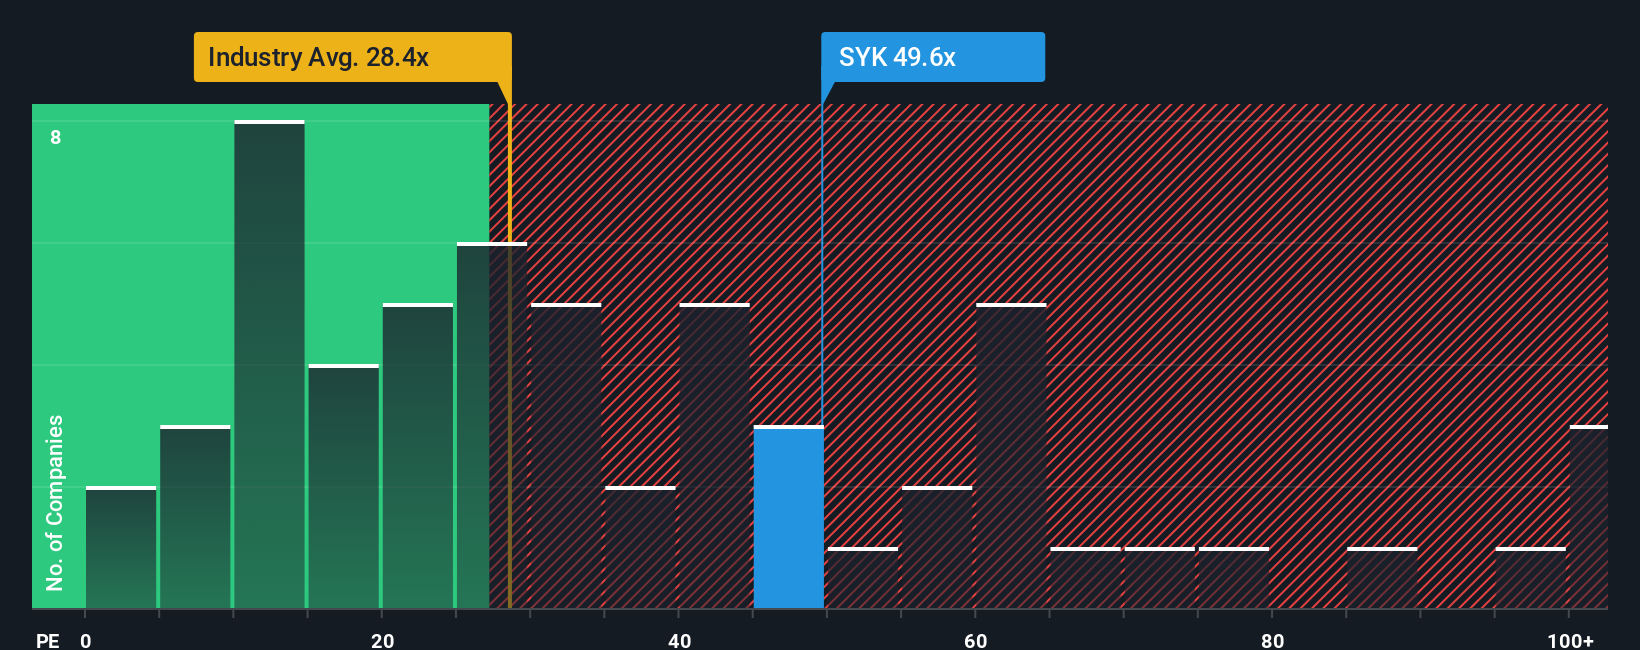
Stryker currently trades on a P/E of 46.14x. That is above the Medical Equipment industry average of 31.99x and also above the peer average of 42.49x. Simply Wall St’s Fair Ratio for Stryker is 40.45x, which is the P/E level it estimates based on factors such as Stryker’s earnings growth profile, industry, profit margins, market cap and risk characteristics. This Fair Ratio can be more informative than a simple peer or industry comparison because it adjusts for those company specific factors rather than assuming all firms deserve similar multiples.
With the current P/E of 46.14x compared to the Fair Ratio of 40.45x, Stryker screens as trading above that fair value range on this approach.
Result: OVERVALUED
P/E ratios tell one story, but what if the real opportunity lies elsewhere? Discover 1421 companies where insiders are betting big on explosive growth.
Upgrade Your Decision Making: Choose your Stryker Narrative
Earlier we mentioned that there is an even better way to understand valuation, so let us introduce you to Narratives, a simple way to link your view of Stryker’s story to the numbers behind it.
A Narrative lets you spell out your perspective on the company, then connect that story to specific assumptions about future revenue, earnings and margins, which flow through to a forecast and an estimated fair value.
On Simply Wall St’s Community page, used by millions of investors, Narratives are an accessible tool where you can see different fair value estimates for Stryker, compare them to the current share price, and use that gap to help decide whether you see the stock as attractive or expensive for your own plan.
Narratives also update when new information like earnings releases or major news is added, so your fair value view and the price versus value comparison stay aligned with the latest data instead of getting stale.
For example, one Stryker Narrative might assume stronger long term revenue growth and assign a higher fair value. Another Narrative might use more conservative revenue and margin estimates, which leads to a lower fair value and a very different conclusion about the same share price.
Do you think there's more to the story for Stryker? Head over to our Community to see what others are saying!
This article by Simply Wall St is general in nature. We provide commentary based on historical data and analyst forecasts only using an unbiased methodology and our articles are not intended to be financial advice. It does not constitute a recommendation to buy or sell any stock, and does not take account of your objectives, or your financial situation. We aim to bring you long-term focused analysis driven by fundamental data. Note that our analysis may not factor in the latest price-sensitive company announcements or qualitative material. Simply Wall St has no position in any stocks mentioned.