Is Syndax Pharmaceuticals (SNDX) Pricing Reflect Pipeline Progress Or Stretching Recent Share Gains
Syndax Pharmaceuticals Inc SNDX | 24.43 24.43 | +0.74% 0.00% Pre |
- Curious whether Syndax Pharmaceuticals' share price really matches what the business could be worth? This article walks you through the key signals that matter before you make up your mind.
- With the stock at US$22.14 and returns of 11.3% over 7 days, 9.0% over 30 days and 43.0% over the past year, recent moves may be changing how investors think about both its potential and its risks.
- Recent company updates and industry developments around Syndax's pipeline progress and regulatory milestones have kept investor attention on how its clinical assets might translate into long term value. These news items help explain why the stock's shorter term performance looks different to the 3 year and 5 year returns of negative 9.2% and negative 5.0% respectively.
- Syndax currently has a valuation score of 4 out of 6 on our checks. Next, we will walk through the standard valuation methods investors often rely on, then finish with a more complete way to think about what the stock might be worth.
Approach 1: Syndax Pharmaceuticals Discounted Cash Flow (DCF) Analysis
A Discounted Cash Flow, or DCF, model estimates what a company could be worth today by projecting its future cash flows and then discounting those cash flows back to the present.
For Syndax Pharmaceuticals, the model used is a 2 Stage Free Cash Flow to Equity approach. The latest twelve month free cash flow (FCF) is a loss of $323.37 million. Analysts and model estimates project that FCF could reach $326.90 million in 2030, with intermediate yearly projections between 2026 and 2035 that combine analyst inputs for the earlier years and extrapolated figures for the later years.
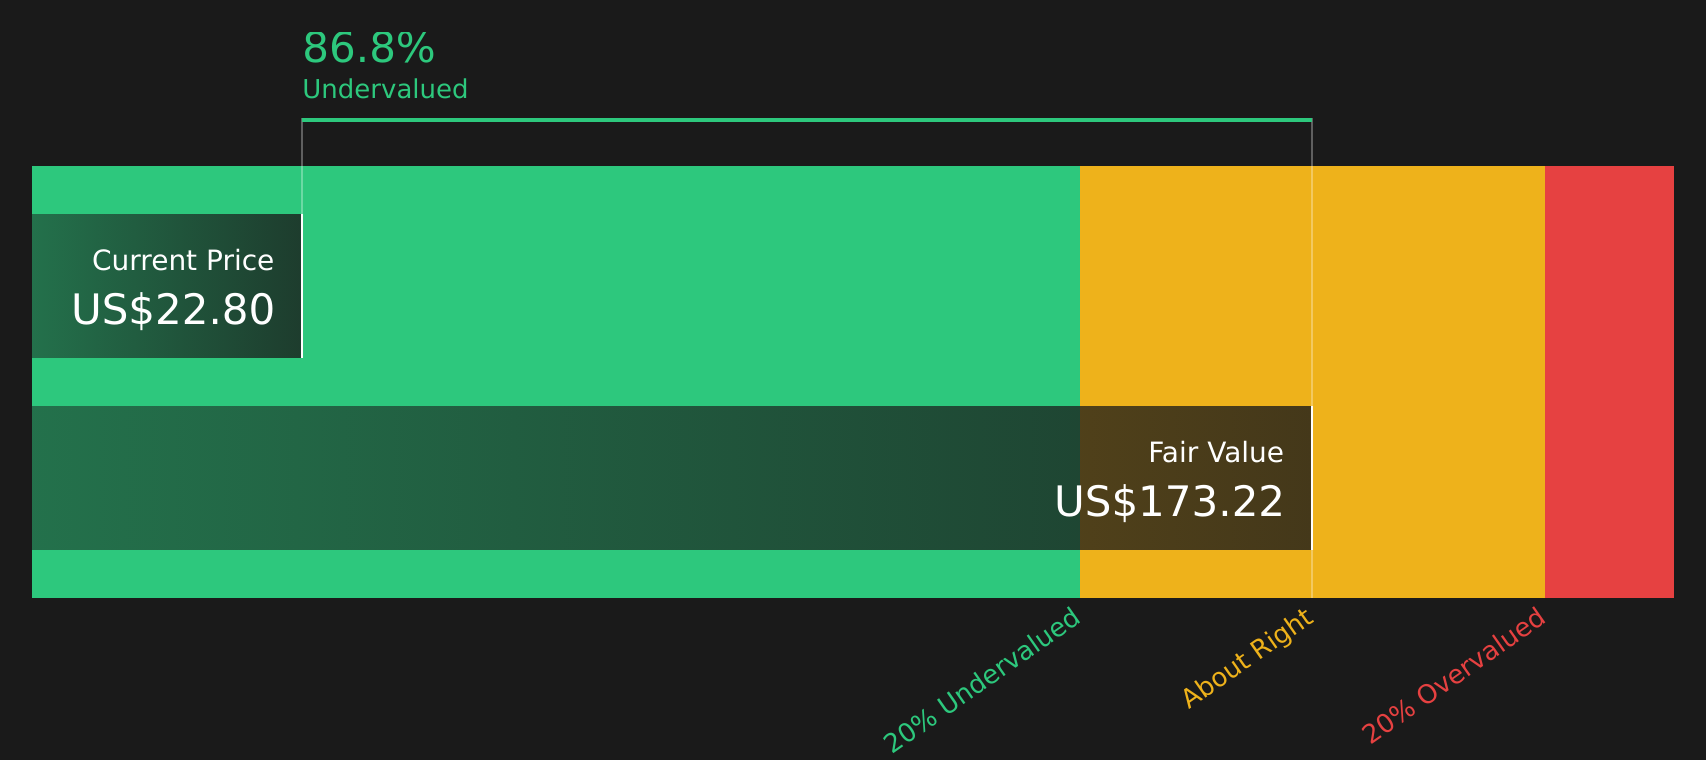
Simply Wall St uses these projected cash flows, all in US$, to calculate an intrinsic value per share of $83.74. Compared to the current share price of $22.14, the model output implies the stock is 73.6% undervalued based purely on these cash flow assumptions.
Result: UNDERVALUED
Our Discounted Cash Flow (DCF) analysis suggests Syndax Pharmaceuticals is undervalued by 73.6%. Track this in your watchlist or portfolio, or discover 45 more high quality undervalued stocks.
Approach 2: Syndax Pharmaceuticals Price vs Sales
For companies where profits are not yet positive or are still volatile, the P/S ratio is often a more practical yardstick than P/E because it looks at what investors are paying for each dollar of current revenue rather than earnings that may be distorted by investment in growth.
In general, higher growth expectations and lower perceived risk can justify a higher P/S multiple, while slower growth and higher risk usually support a lower multiple. That is why simply saying a stock trades on a “high” or “low” P/S does not tell you much without context.
Syndax Pharmaceuticals currently trades at a P/S ratio of 11.33x. This sits below the Biotechs industry average of 12.52x and below the peer group average of 18.12x. Simply Wall St’s Fair Ratio for Syndax is 1.89x. This is the P/S level its model suggests based on factors such as earnings growth, profit margins, industry, market cap and company specific risks.
This Fair Ratio is designed to be more tailored than a simple comparison to peers or the broad industry. It adjusts for those company specific drivers rather than assuming one size fits all. Comparing 11.33x to the Fair Ratio of 1.89x points to Syndax trading above what this framework suggests.
Result: OVERVALUED

P/S ratios tell one story, but what if the real opportunity lies elsewhere? Start investing in legacies, not executives. Discover our 19 top founder-led companies.
Upgrade Your Decision Making: Choose your Syndax Pharmaceuticals Narrative
Earlier we mentioned that there is an even better way to understand valuation. Let us introduce you to Narratives, which are simply your story about Syndax Pharmaceuticals linked to a set of numbers such as your view on future revenue, earnings and margins. These roll up into a Fair Value you can then compare with the current share price to help you judge whether it suits your own buy or sell timing.
On Simply Wall St, Narratives sit inside the Community page. They are used by millions of investors as an easy tool to connect a company’s story to a forecast and a Fair Value that automatically updates when new news, earnings or regulatory developments come through, so your view does not stay static.
For Syndax Pharmaceuticals, one investor might build a more cautious Narrative closer to the US$19 price target with assumptions like earnings of US$73.5 million and a P/E of 27.9x by 2028. Another might lean toward the US$56 view with earnings of US$128.6 million and a P/E of 47.1x. Narratives let you see and compare these different stories in a structured way instead of treating the current price as the only reference point.
Do you think there's more to the story for Syndax Pharmaceuticals? Head over to our Community to see what others are saying!

This article by Simply Wall St is general in nature. We provide commentary based on historical data and analyst forecasts only using an unbiased methodology and our articles are not intended to be financial advice. It does not constitute a recommendation to buy or sell any stock, and does not take account of your objectives, or your financial situation. We aim to bring you long-term focused analysis driven by fundamental data. Note that our analysis may not factor in the latest price-sensitive company announcements or qualitative material. Simply Wall St has no position in any stocks mentioned.