Is T-Mobile (TMUS) Still Attractive After Recent Share Price Weakness?
T-Mobile US, Inc. TMUS | 201.40 | -1.40% |
- If you are wondering whether T-Mobile US at around US$189 a share still offers value or if most of the upside is already priced in, the key is to look closely at what the current valuation is really implying.
- The stock has recently shown mixed returns, with a 2.1% gain over the last 7 days but a 7.1% decline over 30 days, and longer term returns of a 5.2% decline year to date and an 18.0% decline over 1 year, compared with gains of 33.3% over 3 years and 50.0% over 5 years.
- These moves are set against an ongoing debate about how much growth is left in the US wireless market and how competition among major carriers might affect pricing and subscriber trends. Investors are weighing this backdrop as they reassess what they are prepared to pay for T-Mobile US shares and how much risk they see in the current price.
- On Simply Wall St's valuation checks, T-Mobile US scores 5 out of 6. You can see the breakdown in this valuation score of 5, which we will unpack using different valuation methods before finishing with a broader way to think about what the market might be missing.
Approach 1: T-Mobile US Discounted Cash Flow (DCF) Analysis
A Discounted Cash Flow, or DCF, model estimates what a business could be worth by projecting its future cash flows and then discounting those back to today using a required rate of return. It is essentially asking what all those future dollars are worth in today’s terms.
For T-Mobile US, Simply Wall St uses a 2 Stage Free Cash Flow to Equity model. The latest twelve month free cash flow is about $14.0b, and analysts provide explicit forecasts out to 2028, with Simply Wall St extrapolating further out to 2035. For example, projected free cash flow for 2028 is $21.5b, and the discounted values of yearly cash flows from 2026 to 2035 range from about $13.9b to $18.1b according to the model’s assumptions.
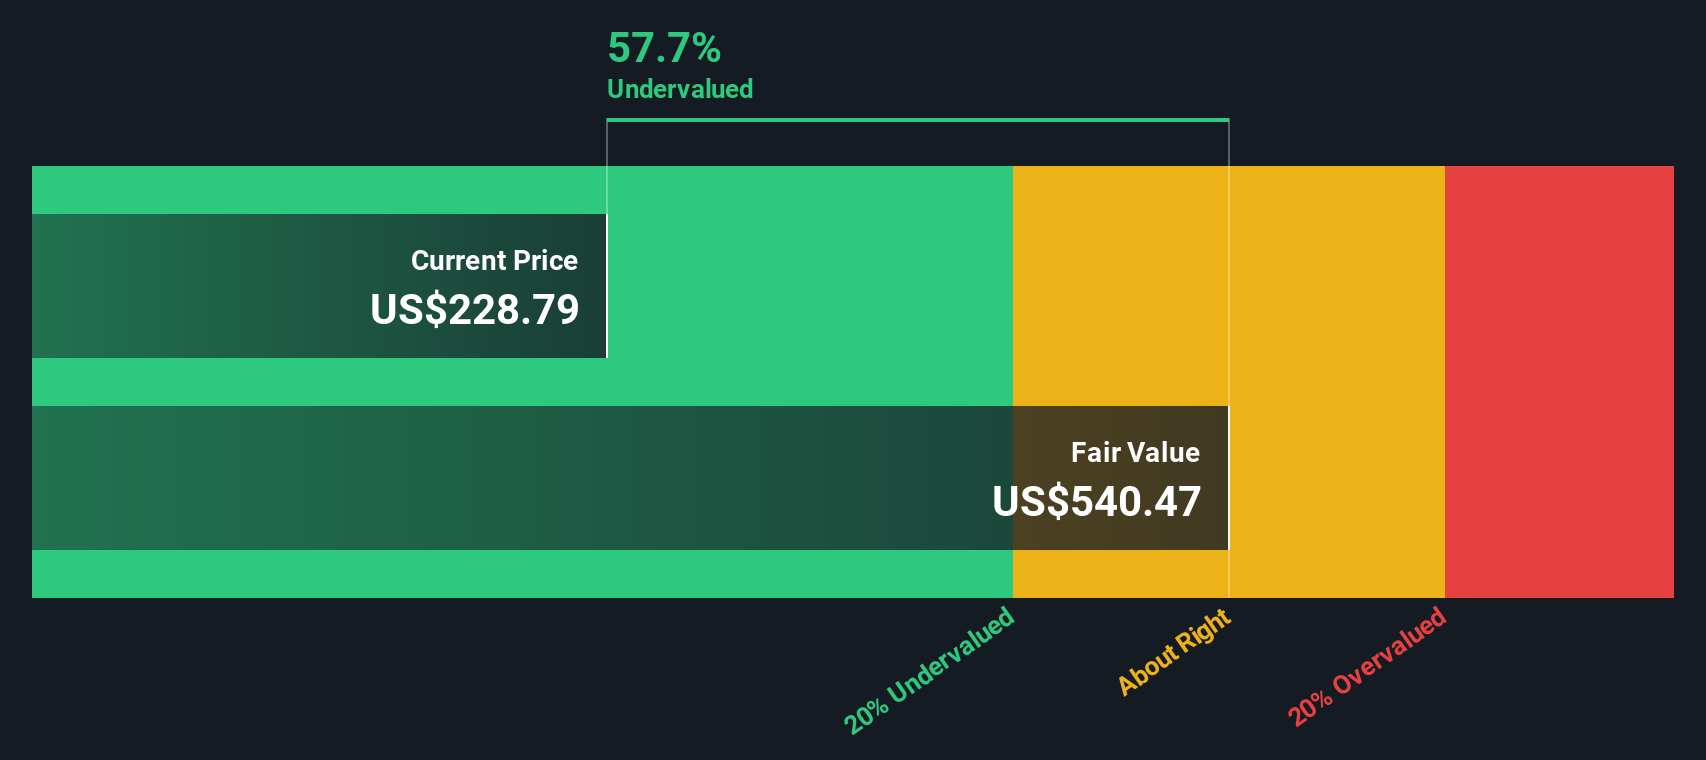
Bringing all of those discounted cash flows together produces an estimated intrinsic value of roughly $490.36 per share. Compared with a current share price around $189, the DCF output suggests the stock is around 61.4% undervalued on these inputs.
Result: UNDERVALUED
Our Discounted Cash Flow (DCF) analysis suggests T-Mobile US is undervalued by 61.4%. Track this in your watchlist or portfolio, or discover 869 more undervalued stocks based on cash flows.
Approach 2: T-Mobile US Price vs Earnings
For a profitable company like T-Mobile US, the P/E ratio is a useful way to relate what you pay per share to the earnings the business is currently generating. It gives you a quick sense of how many years of current earnings are being reflected in the share price.
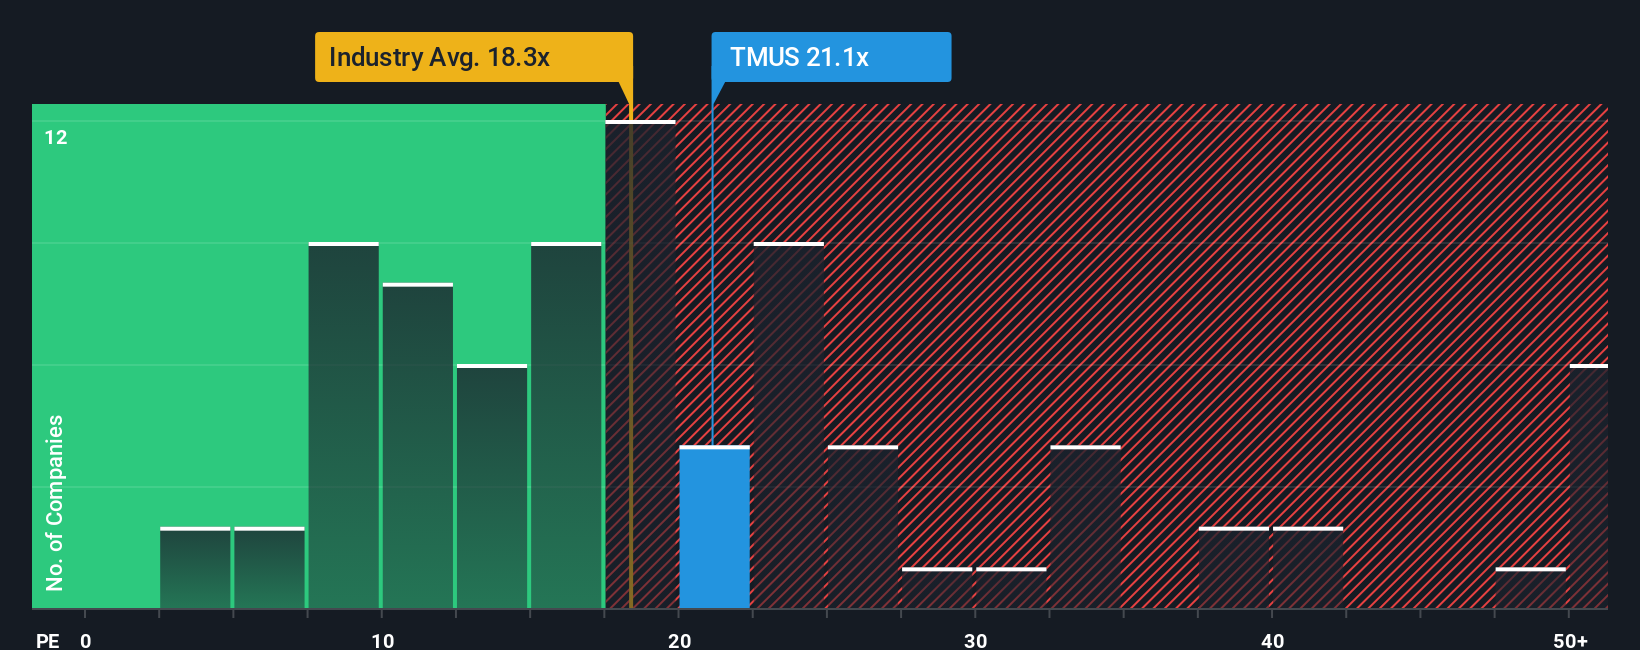
What counts as a “fair” P/E depends on how investors view growth prospects and risk. Higher expected growth or lower perceived risk can support a higher P/E, while slower expected growth or higher risk usually point to a lower P/E. T-Mobile US currently trades on a P/E of 17.84x, compared with the Wireless Telecom industry average of 18.85x and a peer group average of 32.25x.
Simply Wall St’s Fair Ratio for T-Mobile US is 17.42x. This is a proprietary estimate of what the P/E could be given factors such as earnings growth, industry, profit margin, market cap and risk profile. That makes it more tailored than a simple comparison with peers or the broad industry, which may not share the same characteristics. With the actual P/E of 17.84x sitting slightly above the Fair Ratio of 17.42x, the shares screen as mildly overvalued on this measure.
Result: OVERVALUED
P/E ratios tell one story, but what if the real opportunity lies elsewhere? Discover 1418 companies where insiders are betting big on explosive growth.
Upgrade Your Decision Making: Choose your T-Mobile US Narrative
Earlier we mentioned that there is an even better way to understand valuation, so let us introduce you to Narratives, a simple way for you to attach a clear story about T-Mobile US to your numbers such as fair value and your estimates for future revenue, earnings and margins. A Narrative connects three things: what you think is happening with the business, the forecast you build from that view, and the fair value that forecast implies. On Simply Wall St, millions of investors share Narratives on the Community page, so you can see different views, compare them with your own, and quickly check whether the fair value in each Narrative sits above or below the current share price to help you decide if it might be closer to a buy, hold or sell for you. These Narratives update as new information like company news or earnings arrives, so the story and the numbers stay aligned. For T-Mobile US, one Narrative might assume a relatively high fair value with robust revenue growth, while another might use a much lower fair value with more conservative assumptions, showing how the same stock can look very different depending on the story behind the figures.
Do you think there's more to the story for T-Mobile US? Head over to our Community to see what others are saying!

This article by Simply Wall St is general in nature. We provide commentary based on historical data and analyst forecasts only using an unbiased methodology and our articles are not intended to be financial advice. It does not constitute a recommendation to buy or sell any stock, and does not take account of your objectives, or your financial situation. We aim to bring you long-term focused analysis driven by fundamental data. Note that our analysis may not factor in the latest price-sensitive company announcements or qualitative material. Simply Wall St has no position in any stocks mentioned.