Is T-Mobile US (TMUS) Pricing Look Attractive After Recent Share Price Weakness?
T-Mobile US, Inc. TMUS | 190.19 | +0.10% |
- If you are wondering whether T-Mobile US at around US$197 per share is offering good value right now, or if the opportunity has passed you by, this article breaks down what the current price might imply.
- The stock is roughly flat over the last week at 0.1%, with a 1.6% decline over 30 days, a 1.1% decline year to date, but returns of 42.2% over 3 years and 65.2% over 5 years. Long term holders have therefore had a very different experience compared with those focused on the last year, which shows an 18.6% decline.
- Recent coverage around T-Mobile US has centered on its role as a major US telecom operator and on ongoing interest in large, established wireless carriers as potential vehicles for long term exposure to the sector. This context has kept attention on whether the current share price still lines up with the fundamentals.
- Our valuation checks currently give T-Mobile US a score of 5 out of 6. Next we will walk through the main valuation methods behind that score, before finishing with a framework that can help you judge whether the current price really fits your own view of value.
Approach 1: T-Mobile US Discounted Cash Flow (DCF) Analysis
A Discounted Cash Flow, or DCF, model looks at the cash T-Mobile US could generate in the future and then discounts those projected cash flows back to today to estimate what the business might be worth now.
T-Mobile US last reported free cash flow of about $14.0b. Using a 2 Stage Free Cash Flow to Equity model, analysts and extrapolations project free cash flow reaching around $27.2b in 2035. For example, projected free cash flow is $18.9b in 2026 and $21.5b in 2028, with Simply Wall St extending analyst estimates beyond the explicit forecast period.
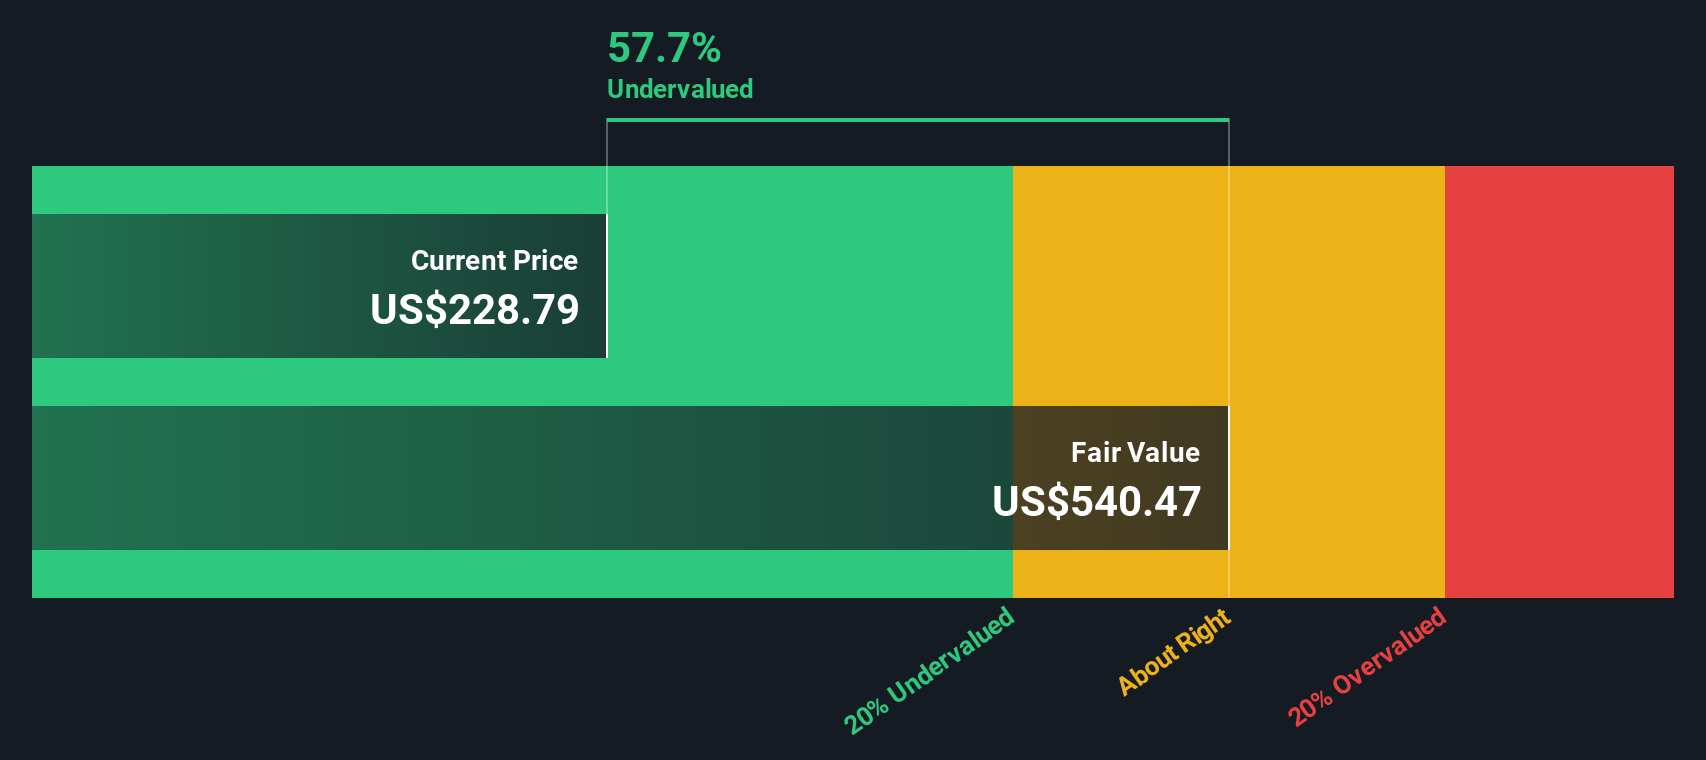
When all those future cash flows are discounted back to today in this model, the implied intrinsic value is about $502.54 per share. Compared with the current share price of around $197, the DCF output suggests the shares are trading at a 60.7% discount, which screens as materially undervalued on this methodology alone.
Result: UNDERVALUED
Our Discounted Cash Flow (DCF) analysis suggests T-Mobile US is undervalued by 60.7%. Track this in your watchlist or portfolio, or discover 52 more high quality undervalued stocks.
Approach 2: T-Mobile US Price vs Earnings
For a profitable company like T-Mobile US, the P/E ratio is a straightforward way to think about what you are paying for each dollar of current earnings. Investors usually accept a higher or lower P/E depending on what they expect for future earnings growth and how much risk they see in the business, so there is no single “right” number that suits every company.
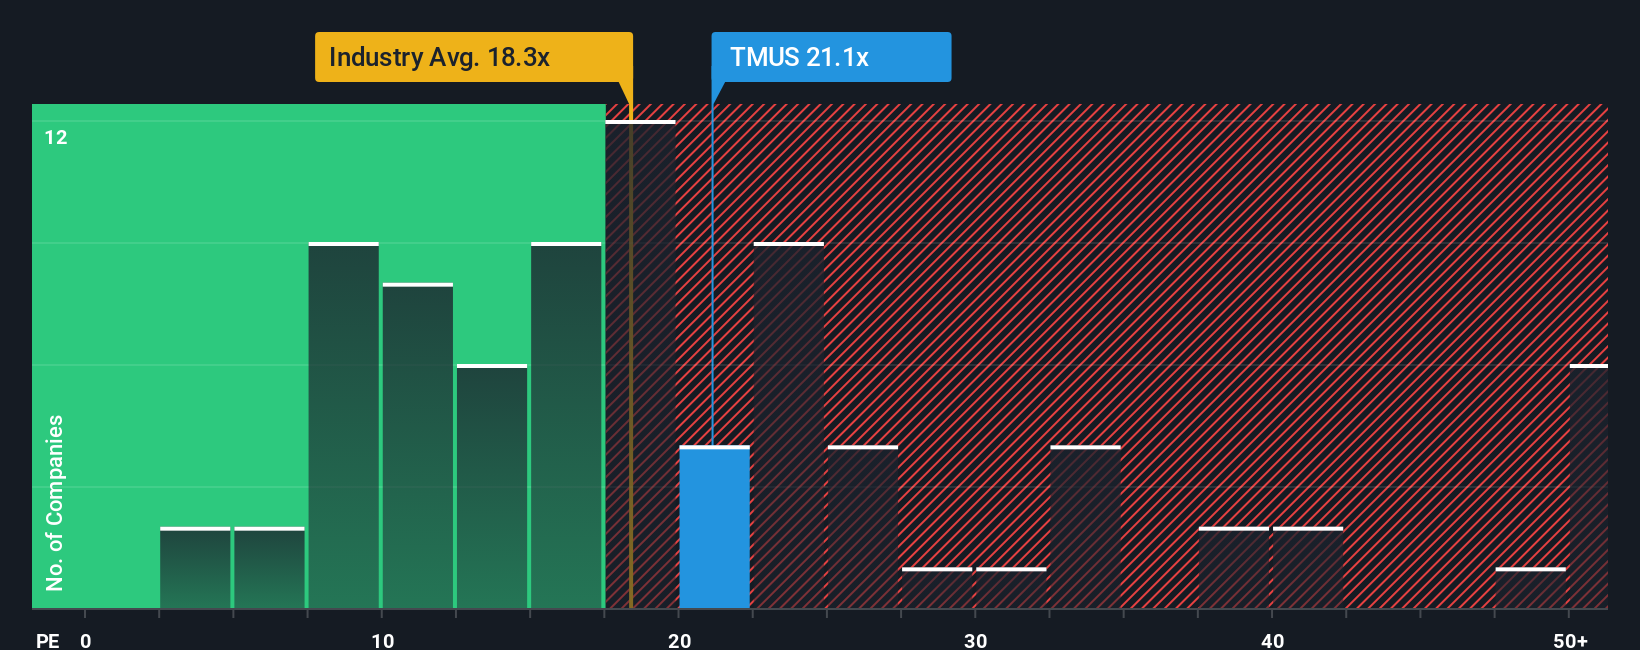
T-Mobile US currently trades on a P/E of about 18.6x. That sits close to the Wireless Telecom industry average of about 18.75x and below the broader peer group average of around 33.06x. On the surface, that suggests the shares are priced more in line with the sector than with higher rated peers.
Simply Wall St’s Fair Ratio for T-Mobile US is 16.31x. This is a proprietary estimate of what a reasonable P/E might look like after considering the company’s earnings growth profile, profit margins, industry, market capitalization and risk factors. Because it folds these elements into a single figure, the Fair Ratio can be more tailored than a simple comparison against industry or peer averages. With the current P/E of 18.6x sitting above the Fair Ratio of 16.31x, this approach suggests the shares screen as overvalued on an earnings multiple basis.
Result: OVERVALUED
P/E ratios tell one story, but what if the real opportunity lies elsewhere? Start investing in legacies, not executives. Discover our 22 top founder-led companies.
Upgrade Your Decision Making: Choose your T-Mobile US Narrative
Earlier we mentioned that there is an even better way to understand valuation, so let us introduce you to Narratives, which are simply your own story about T-Mobile US that sits behind the numbers you use for fair value, future revenue, earnings and margins.
A Narrative connects what you believe about the business to a concrete financial forecast and then to an estimated fair value, so you are not just looking at ratios in isolation but at a joined up picture of story, forecast and price.
On Simply Wall St, Narratives live in the Community page and are used by millions of investors as an easy, accessible way to compare their view of fair value with the current share price and to decide whether that gap suggests a possible buy, hold or sell action for them.
Narratives are also updated as new information like news or earnings comes in. For example, one T-Mobile US Narrative might assume higher future margins and a higher fair value, while another might assume more modest assumptions and a lower fair value. Both can adjust over time as fresh data is added.
Do you think there's more to the story for T-Mobile US? Head over to our Community to see what others are saying!

This article by Simply Wall St is general in nature. We provide commentary based on historical data and analyst forecasts only using an unbiased methodology and our articles are not intended to be financial advice. It does not constitute a recommendation to buy or sell any stock, and does not take account of your objectives, or your financial situation. We aim to bring you long-term focused analysis driven by fundamental data. Note that our analysis may not factor in the latest price-sensitive company announcements or qualitative material. Simply Wall St has no position in any stocks mentioned.