Is Teladoc (TDOC) Now Offering Value After Multi‑Year Share Price Declines
Teladoc Health, Inc. TDOC | 5.27 | -0.19% |
- If you are looking at Teladoc Health and wondering whether the current share price reflects its true value, you are not alone.
- The stock last closed at US$6.16, with returns of a 6.8% decline over 7 days, 15.2% decline over 30 days, 12.6% decline year to date, 37.7% decline over 1 year, 77.2% decline over 3 years and 97.8% decline over 5 years.
- Recent coverage around Teladoc has focused on its role as a major telehealth provider, with attention on how virtual care fits into broader healthcare delivery and competition in digital health. This context helps frame why investors are rethinking the risk and long term potential of the business.
- On our checks, Teladoc scores a 5/6 valuation score. We will break this down using several common valuation methods, and then circle back at the end to a more complete way of thinking about what that score really means for you.
Approach 1: Teladoc Health Discounted Cash Flow (DCF) Analysis
A Discounted Cash Flow, or DCF, model estimates what a company might be worth by projecting its future cash flows and discounting them back to today to reflect risk and the time value of money.
For Teladoc Health, the model used is a 2 Stage Free Cash Flow to Equity approach. The latest twelve month Free Cash Flow is US$142.4 million. Based on analyst inputs for the next few years and then Simply Wall St extrapolations after that, projected Free Cash Flow reaches US$242.3 million in 2035, all in US$ terms.
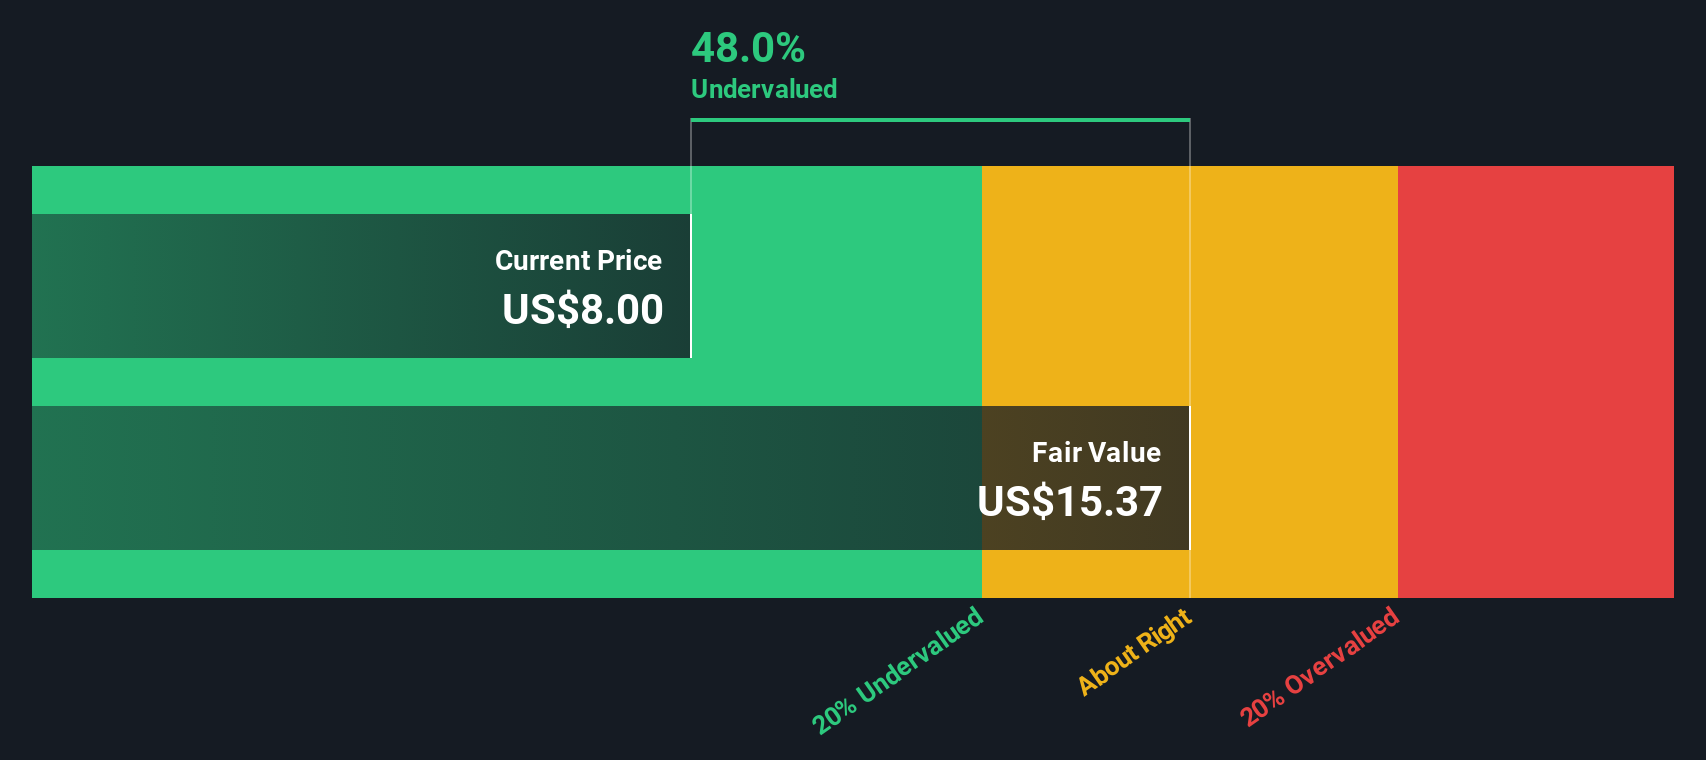
When those cash flows from 2026 through 2035 are discounted back using this model, the estimated intrinsic value comes out at US$13.62 per share. Compared with the recent share price of US$6.16, the DCF output suggests Teladoc Health trades at a 54.8% discount, which indicates that the stock is undervalued on this measure alone.
Result: UNDERVALUED
Our Discounted Cash Flow (DCF) analysis suggests Teladoc Health is undervalued by 54.8%. Track this in your watchlist or portfolio, or discover 881 more undervalued stocks based on cash flows.
Approach 2: Teladoc Health Price vs Sales
For companies where earnings are limited or volatile, the P/S ratio is often a more useful gauge of value because it compares what you pay for each dollar of revenue, rather than each dollar of profit. What investors are really judging here is how the market prices Teladoc Health’s revenue stream given its growth prospects and risks.
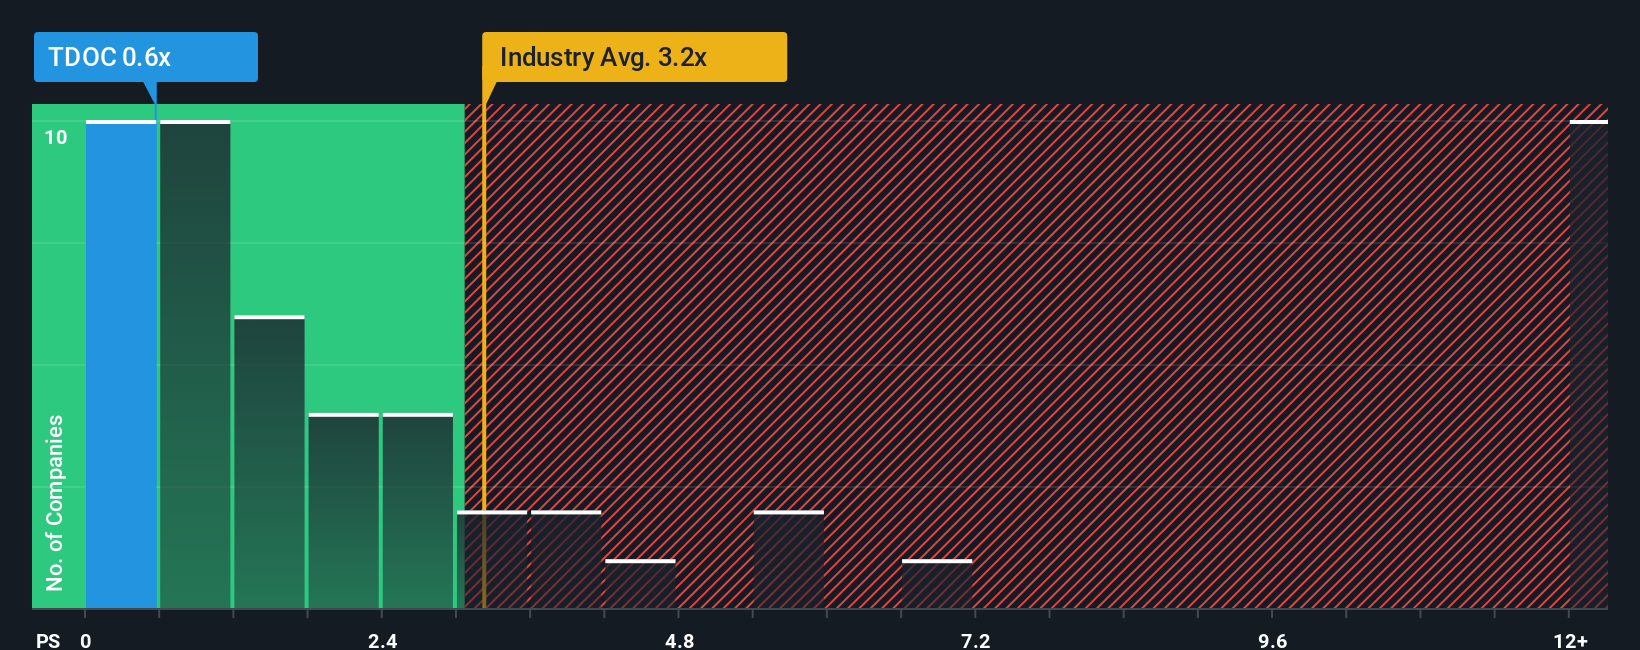
Higher growth expectations or lower perceived risk usually justify a higher P/S multiple, while slower growth or higher risk often lead to a lower multiple being seen as more normal. Teladoc Health is currently trading on a P/S of 0.43x, compared with the Healthcare Services industry average of 2.23x and a peer average of 2.88x.
Simply Wall St’s Fair Ratio for Teladoc Health is 1.99x P/S. This is a proprietary estimate of what a reasonable P/S might be, given factors such as earnings growth, profit margin, market cap, industry and company specific risks. That makes it more tailored than a simple comparison to peers or the broad industry, which can miss important differences between businesses. Against this Fair Ratio, Teladoc Health’s current 0.43x P/S suggests the shares are trading below that level.
Result: UNDERVALUED
P/S ratios tell one story, but what if the real opportunity lies elsewhere? Discover 1447 companies where insiders are betting big on explosive growth.
Upgrade Your Decision Making: Choose your Teladoc Health Narrative
Earlier we mentioned that there is an even better way to understand valuation, so let us introduce you to Narratives, which are simply your story about a company linked directly to your assumptions about its future revenue, earnings, margins and fair value.
On Simply Wall St, Narratives live in the Community page and let you connect Teladoc Health’s business story to a financial forecast, then to a fair value that you can immediately compare with the current share price.
Because Narratives on the platform update when new information such as earnings or news is added, your view of Teladoc Health’s fair value and your sense of whether the stock looks attractive, fully valued, or expensive can adjust as the facts change.
For example, one Teladoc Health Narrative might see strong virtual care adoption and assign a higher fair value, while another might focus on competitive pressure and regulatory risk and land on a much lower fair value. You can then decide which story fits your own view best.
Do you think there's more to the story for Teladoc Health? Head over to our Community to see what others are saying!

This article by Simply Wall St is general in nature. We provide commentary based on historical data and analyst forecasts only using an unbiased methodology and our articles are not intended to be financial advice. It does not constitute a recommendation to buy or sell any stock, and does not take account of your objectives, or your financial situation. We aim to bring you long-term focused analysis driven by fundamental data. Note that our analysis may not factor in the latest price-sensitive company announcements or qualitative material. Simply Wall St has no position in any stocks mentioned.